Fig. 1.
Download original image
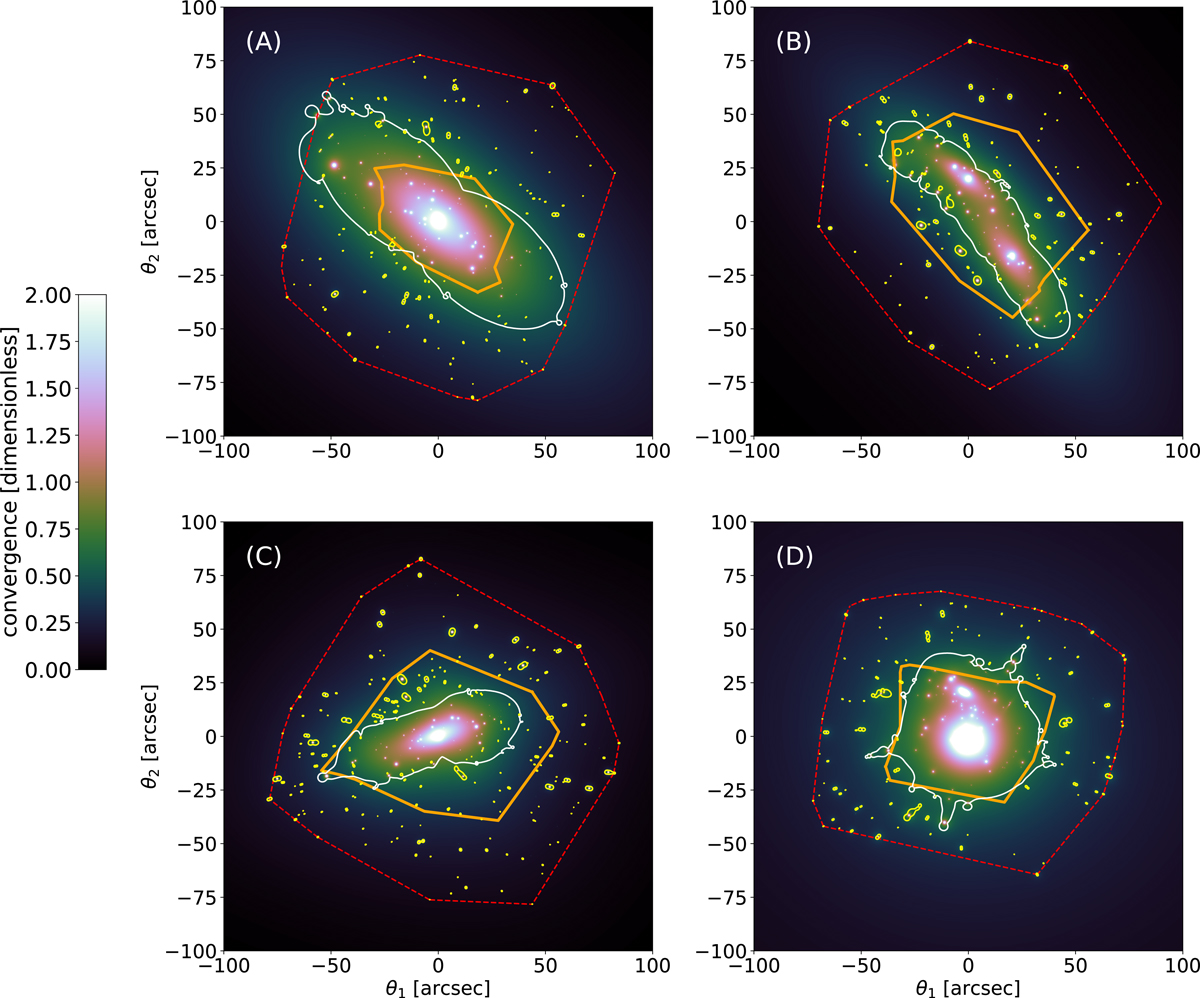
Reconstructed convergence maps for zs = 3 of Abell S1063 (panel A), MACS J0416.1-2403 (panel B), MACS J1206.2-0847 (panel C), and PSZ1 G311.65-18.48 (panel D). We also show the primary and secondary critical lines (solid white and yellow lines, respectively). The dashed red lines mark the region in the lens plane containing all the cluster members included in the mass models. When mapped onto the source plane, these lines correspond to the thick solid orange lines, which show the size of the region in the source plane that contains all the secondary caustics.
Current usage metrics show cumulative count of Article Views (full-text article views including HTML views, PDF and ePub downloads, according to the available data) and Abstracts Views on Vision4Press platform.
Data correspond to usage on the plateform after 2015. The current usage metrics is available 48-96 hours after online publication and is updated daily on week days.
Initial download of the metrics may take a while.