Fig. 6
Download original image
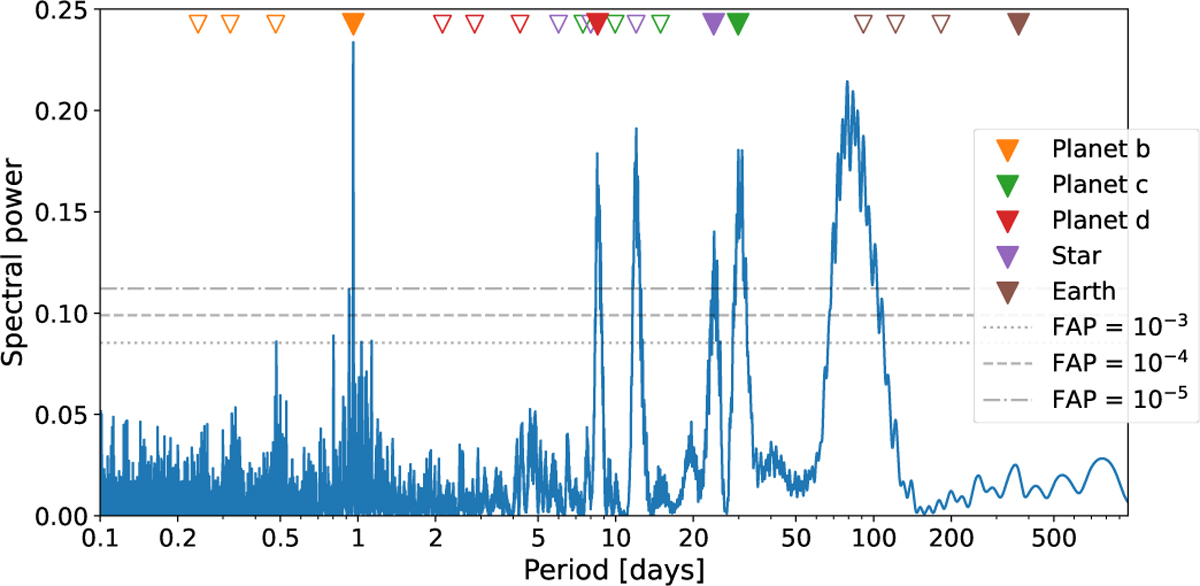
Generalized Lomb-Scargle periodogram of the RV data. The colored triangles at the top represent several periods of interest: orbital periods of the planets b, c and d, expected rotation period of the star (~24 days), and one year. The full triangles show the main periods while the empty ones are the first three harmonics of each period. The horizontal grey lines highlight the False Alarm Probabilities (FAP) of 10−3, 10−4 and 10−5.
Current usage metrics show cumulative count of Article Views (full-text article views including HTML views, PDF and ePub downloads, according to the available data) and Abstracts Views on Vision4Press platform.
Data correspond to usage on the plateform after 2015. The current usage metrics is available 48-96 hours after online publication and is updated daily on week days.
Initial download of the metrics may take a while.