Open Access
Fig. 3
Download original image
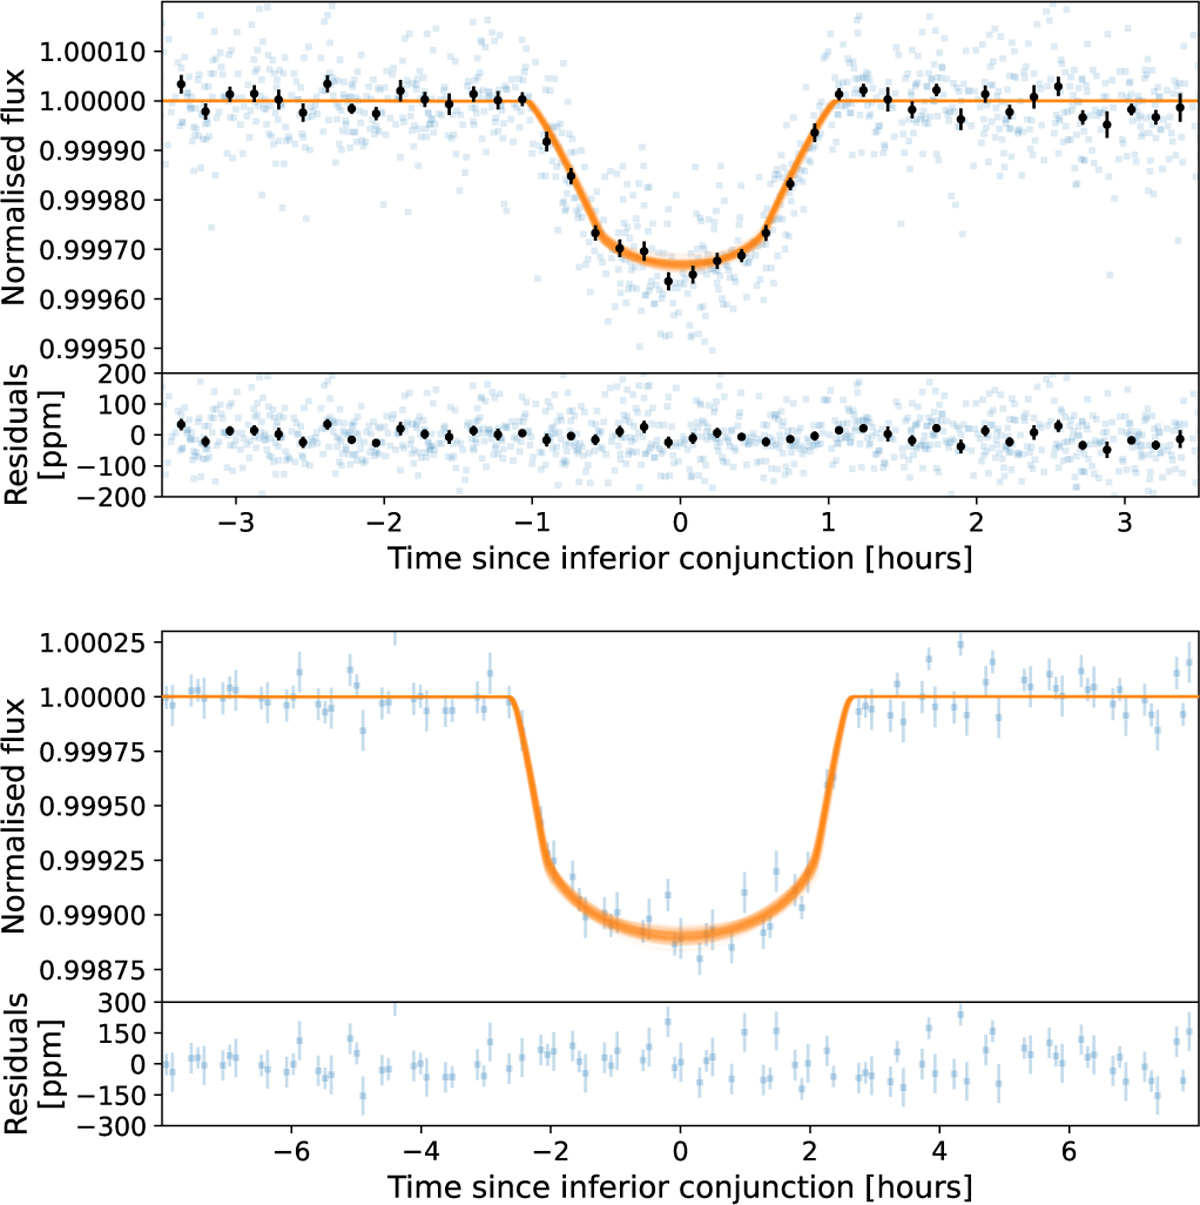
K2 phase-folded transits of planets b (top) and c (bottom). Blue points represent the data after detrending for any other signal. The orange curve are transit models with parameter sets randomly drawn from the posterior distribution. Binned data are represented in the top panel (transit of planet b).
Current usage metrics show cumulative count of Article Views (full-text article views including HTML views, PDF and ePub downloads, according to the available data) and Abstracts Views on Vision4Press platform.
Data correspond to usage on the plateform after 2015. The current usage metrics is available 48-96 hours after online publication and is updated daily on week days.
Initial download of the metrics may take a while.