Open Access
Fig. B.1
Download original image
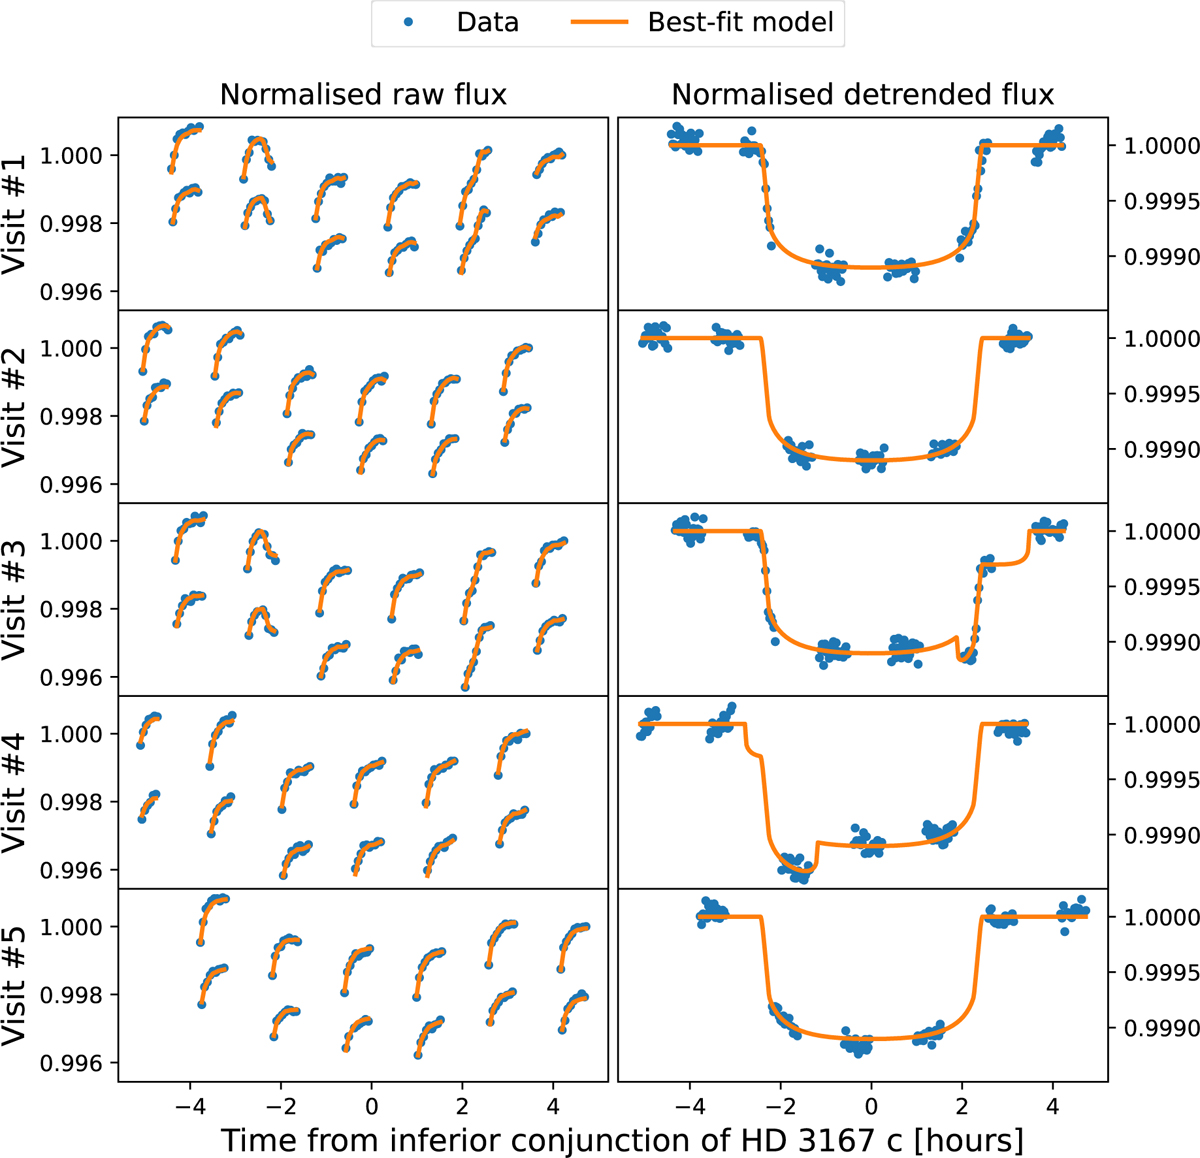
HST observations of HD 3167 c. The left column shows the raw data in blue with the best model in orange for the 5 visits. The right column represents the detrended data with the transit model in orange. Visit 3 and 4 are affected by a serendipitous transit of HD 3167 b.
Current usage metrics show cumulative count of Article Views (full-text article views including HTML views, PDF and ePub downloads, according to the available data) and Abstracts Views on Vision4Press platform.
Data correspond to usage on the plateform after 2015. The current usage metrics is available 48-96 hours after online publication and is updated daily on week days.
Initial download of the metrics may take a while.