Fig. 2
Download original image
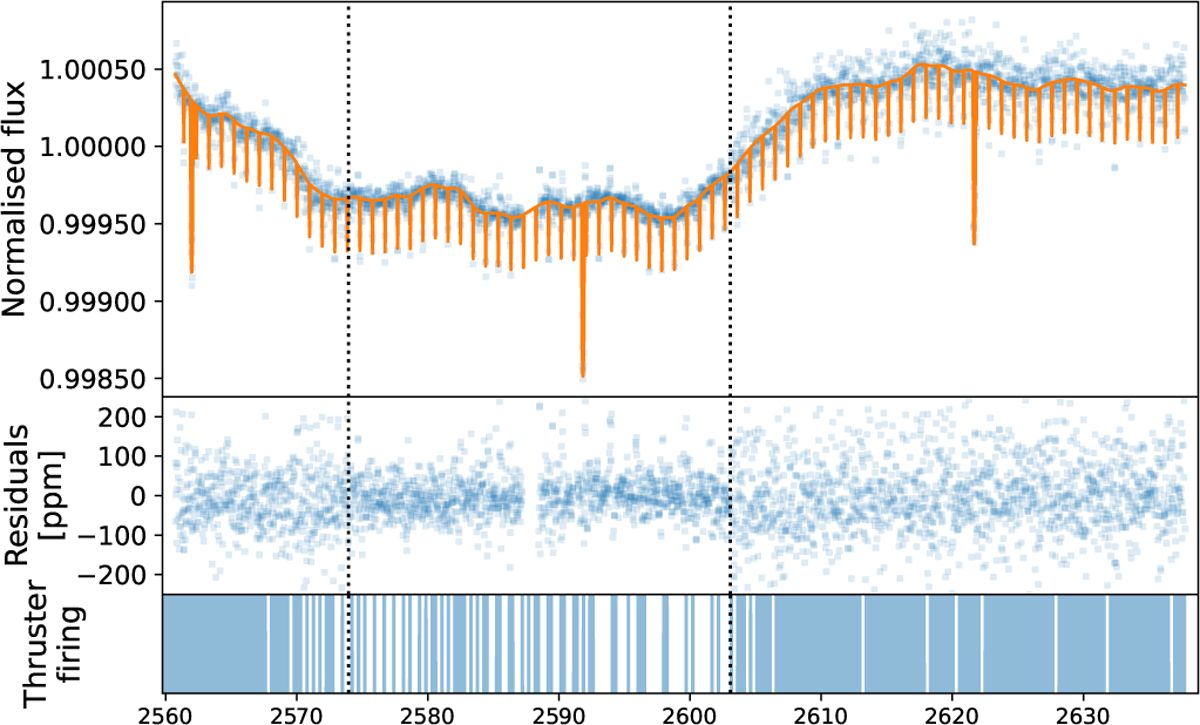
Noise level time ranges in the K2 time series. Top panel: normalized K2 flux (blue points) with the best-fit model (transits + GP) obtained from minimization. Mid-panel: residuals data after removing best-fit model. Bottom panel: flag indicating when the K2 spacecraft is firing its thrusters to correct pointing drifts. In all three panels, the vertical dotted black lines show the noise jump timings providing the best likelihood.
Current usage metrics show cumulative count of Article Views (full-text article views including HTML views, PDF and ePub downloads, according to the available data) and Abstracts Views on Vision4Press platform.
Data correspond to usage on the plateform after 2015. The current usage metrics is available 48-96 hours after online publication and is updated daily on week days.
Initial download of the metrics may take a while.