Fig. 9
Download original image
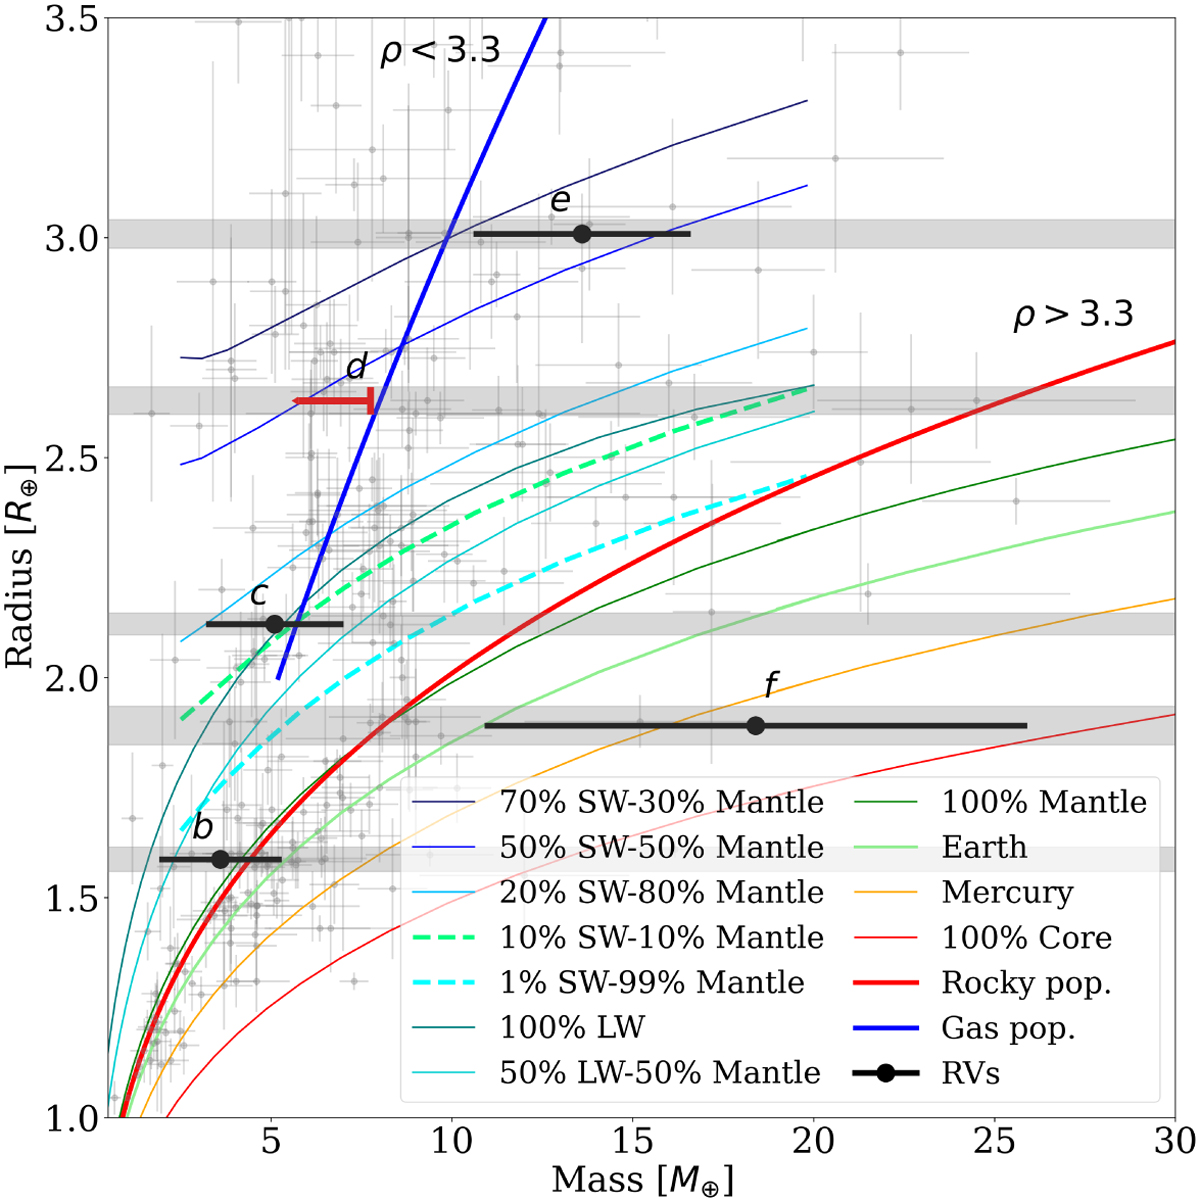
Mass-radius diagram for planets with radius and masses below 3.5 R⊕ and 30 M⊕, respectively. The radius of the HD 108236’s planets obtained from the transits modeling are represented by the gray horizontal regions, while the mass values suggested by the RV fit are represented by the black symbols. The upper limit in the mass of planet d (based on estimations from Teske et al. 2021 and Bonfanti et al. 2021) is marked with the red arrow. We compared the HD 108236 planets with the current planet population (with estimates of mass and radius better than 30%) represented by the gray symbols and the MR relations from Otegi et al. (2020) (blue and red thick lines). The planet interiors models from Brugger et al. (2017) and Acuña et al. (2021) are represented by the thin curves.
Current usage metrics show cumulative count of Article Views (full-text article views including HTML views, PDF and ePub downloads, according to the available data) and Abstracts Views on Vision4Press platform.
Data correspond to usage on the plateform after 2015. The current usage metrics is available 48-96 hours after online publication and is updated daily on week days.
Initial download of the metrics may take a while.