Fig. 5
Download original image
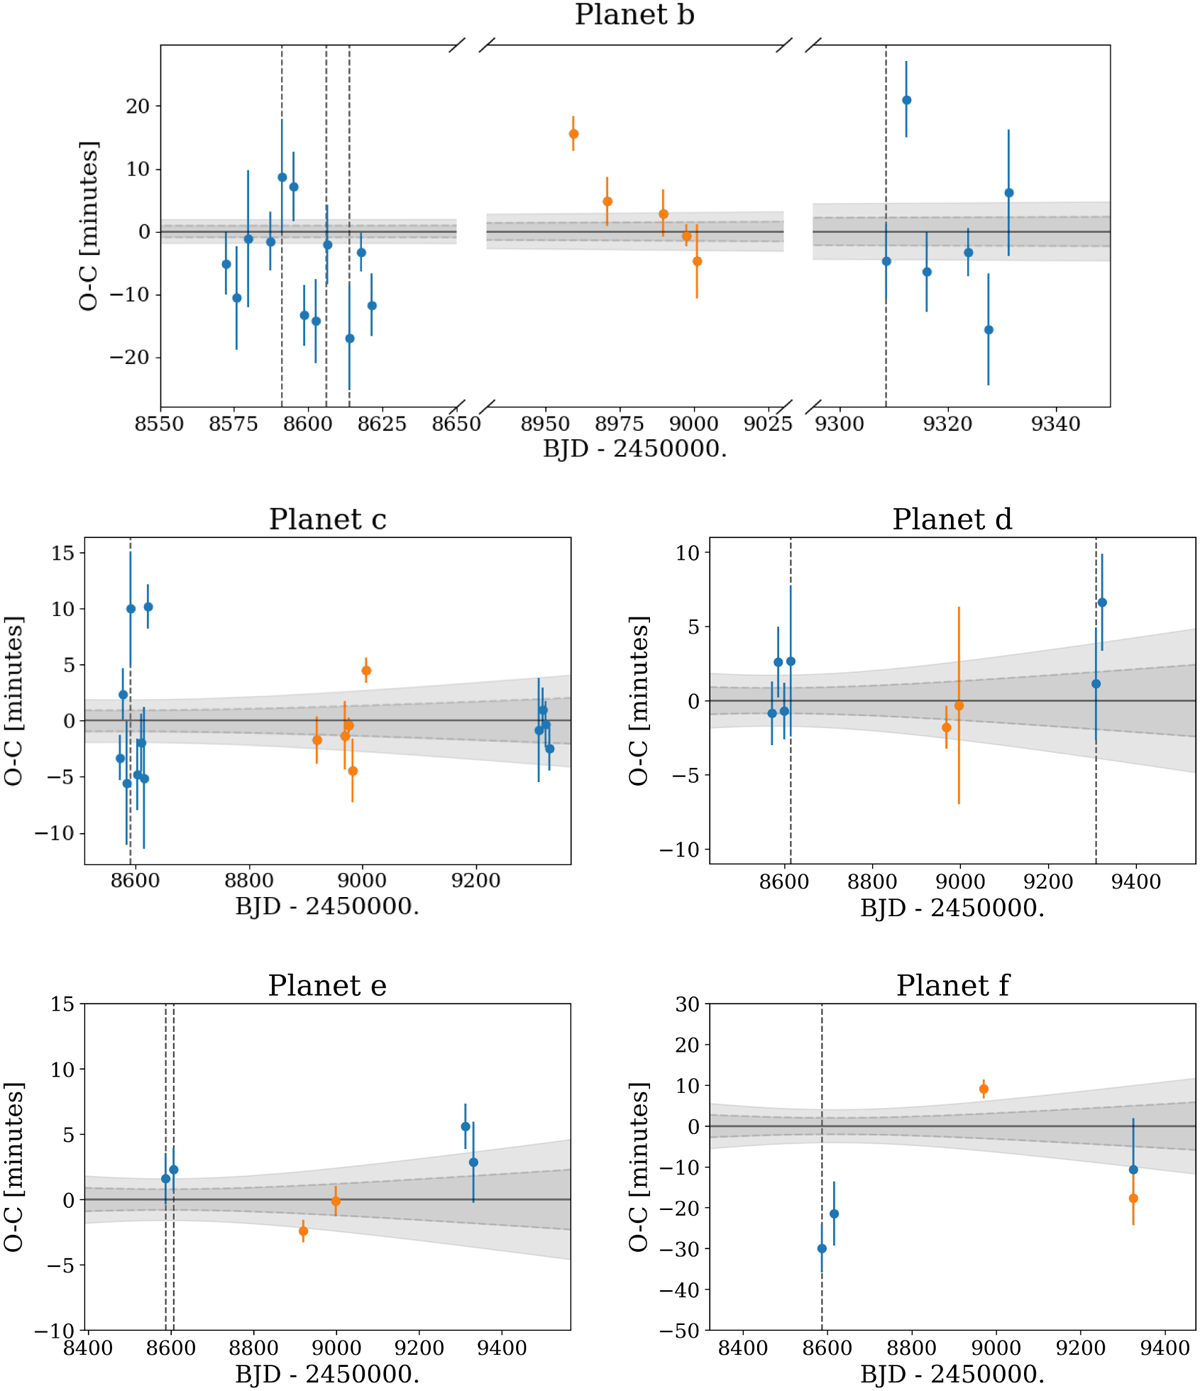
Observed minus calculated diagrams of the transit times of the five planets of the HD 108236 system, obtained by using the ephemeris of the global fit or the updated T0 values reported in Table 5. Transit times were obtained from the individual analysis of the transits (see Sect. 4). Blue and orange symbols correspond, respectively, to TESS and CHEOPS observations. The gray regions represent the ±1–2σ uncertainties of the ephemeris equations. Vertical dashed lines mark overlapped transits in the light curves.
Current usage metrics show cumulative count of Article Views (full-text article views including HTML views, PDF and ePub downloads, according to the available data) and Abstracts Views on Vision4Press platform.
Data correspond to usage on the plateform after 2015. The current usage metrics is available 48-96 hours after online publication and is updated daily on week days.
Initial download of the metrics may take a while.