Fig. 4
Download original image
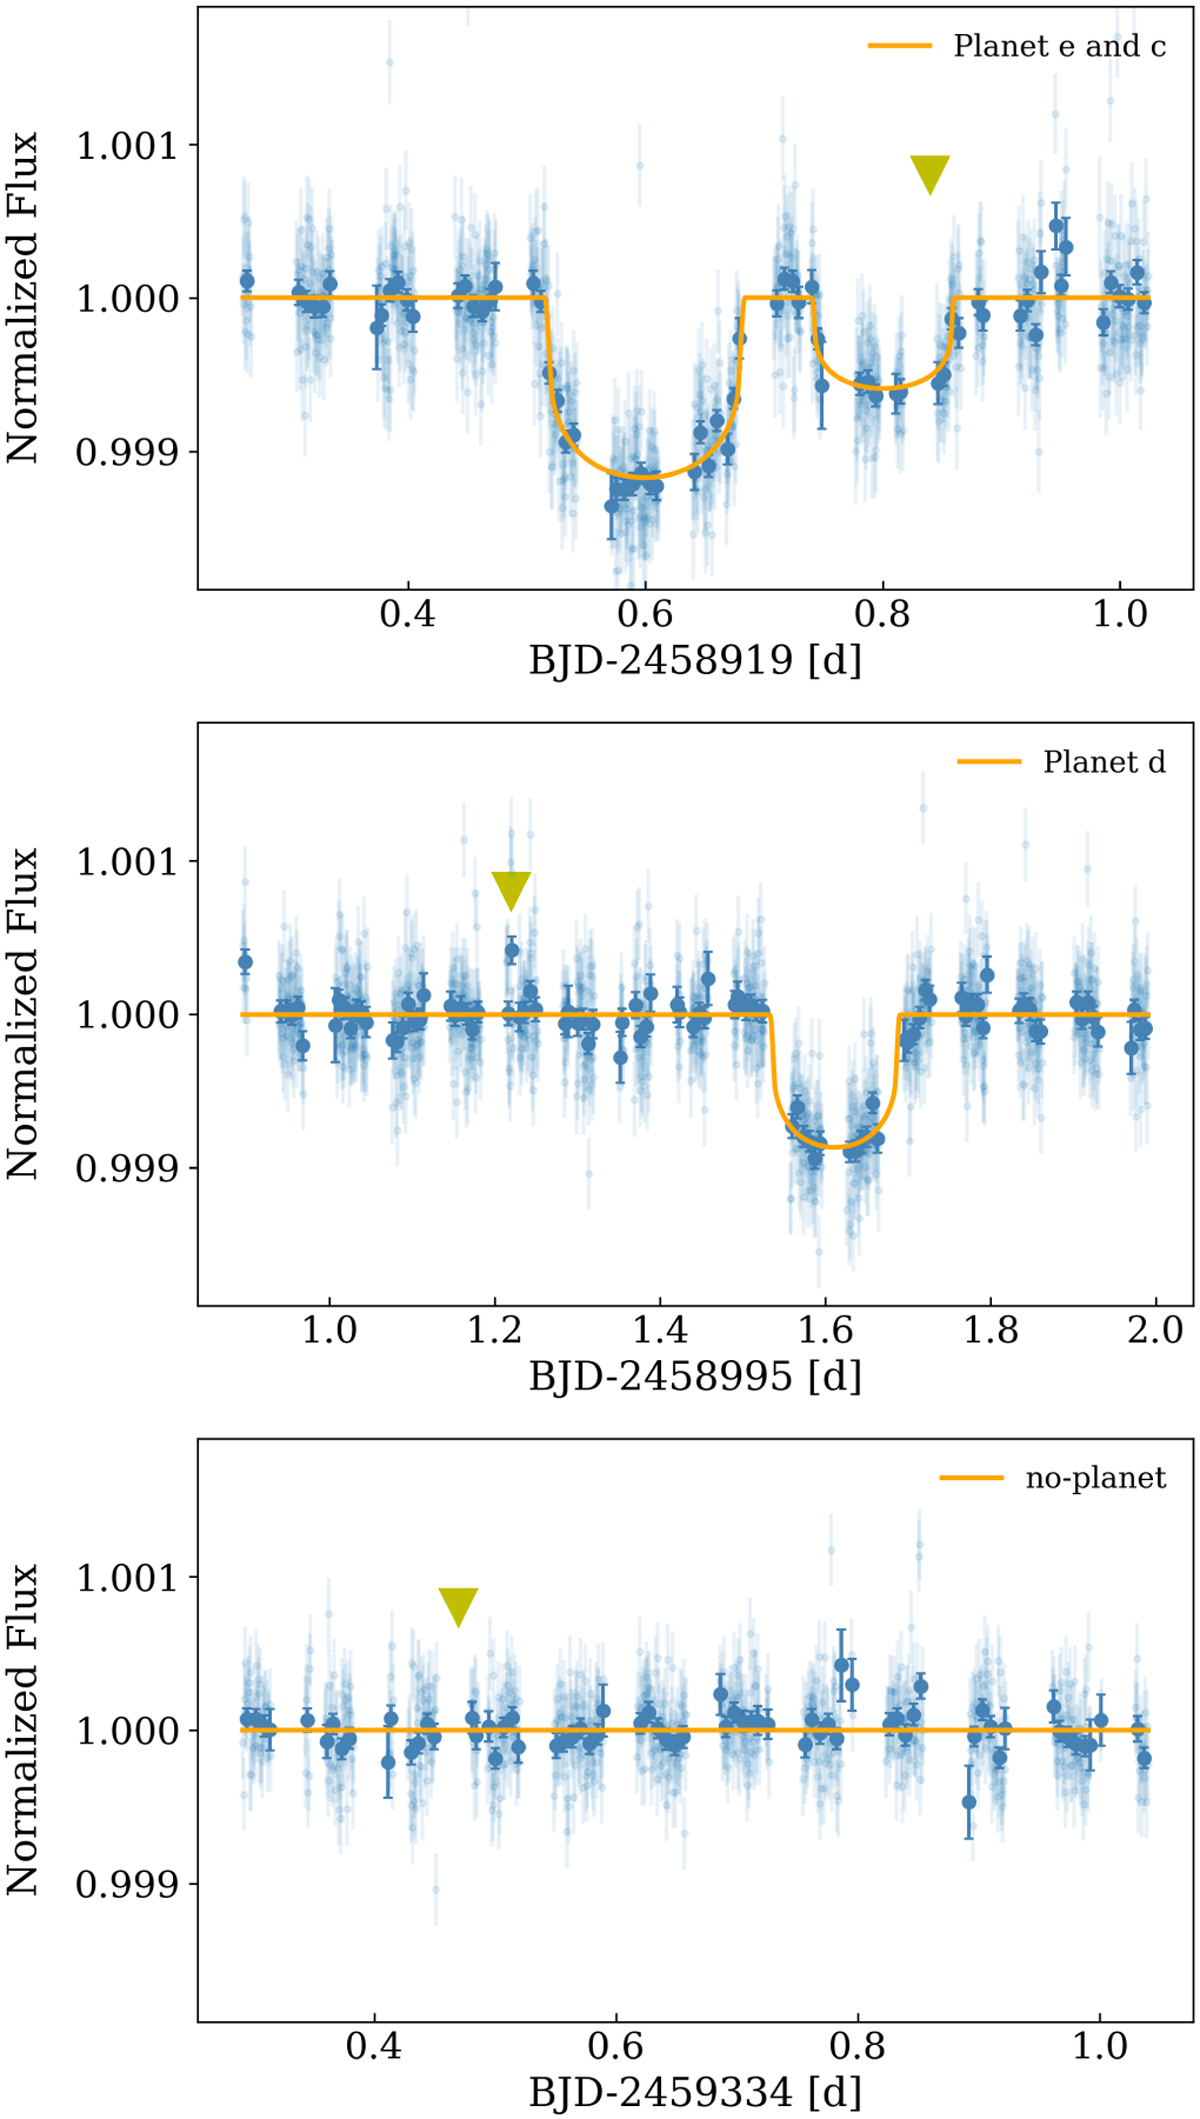
CHEOPS light curves of HD 108236 during the expected transit time of a potential planet g (marked with the yellow triangle). These light curves correspond to observations 1, 9, and 15 in Table 3 (top-to-bottom). Light and dark blue dots represent the detrended and 10 min bins photometric points. No significant statistical evidence of a transit signal with ~10.9 d period is found in these photometric time series.
Current usage metrics show cumulative count of Article Views (full-text article views including HTML views, PDF and ePub downloads, according to the available data) and Abstracts Views on Vision4Press platform.
Data correspond to usage on the plateform after 2015. The current usage metrics is available 48-96 hours after online publication and is updated daily on week days.
Initial download of the metrics may take a while.