Fig. 3
Download original image
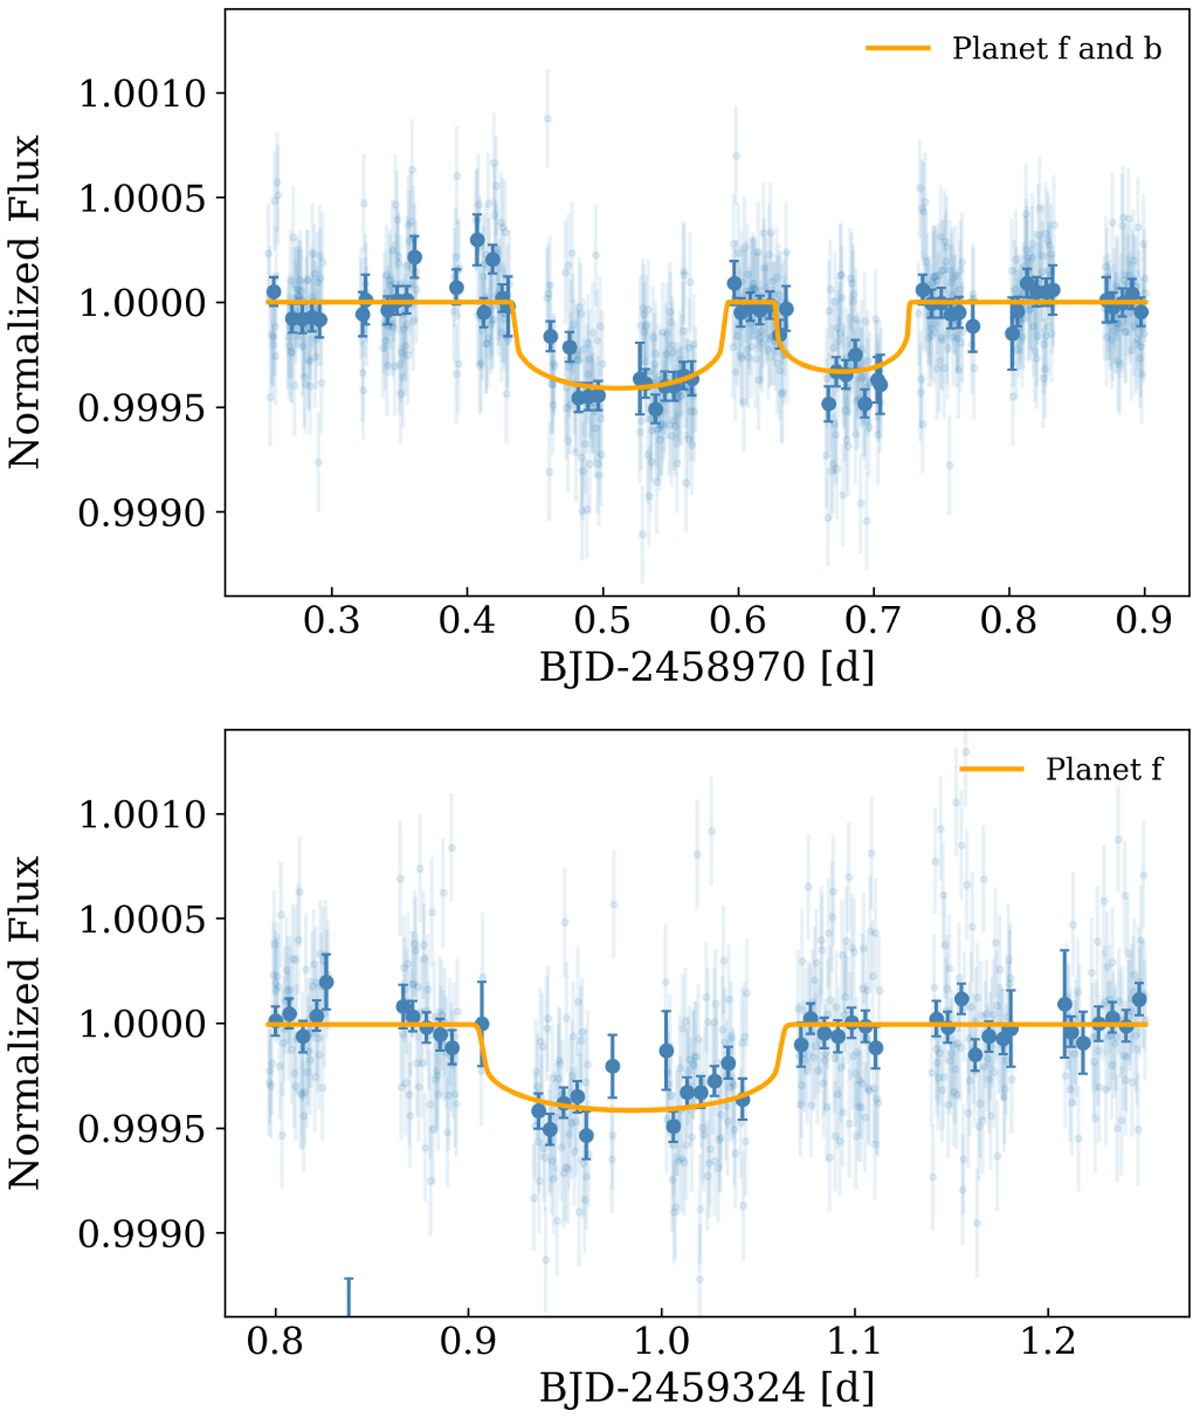
CHEOPS light curve of HD 108236 during a transit of planet f (~2458 970.5 BJD) and b (~2458 970.7 BJD) (top panel), as well as during a dedicated observation of a planet f transit (bottom panel). Detrended photometric points and its 10 min bins are represented by light and dark blue dots, respectively. The best model for each planet is represented by the yellow curve.
Current usage metrics show cumulative count of Article Views (full-text article views including HTML views, PDF and ePub downloads, according to the available data) and Abstracts Views on Vision4Press platform.
Data correspond to usage on the plateform after 2015. The current usage metrics is available 48-96 hours after online publication and is updated daily on week days.
Initial download of the metrics may take a while.