Open Access
Fig. 2
Download original image
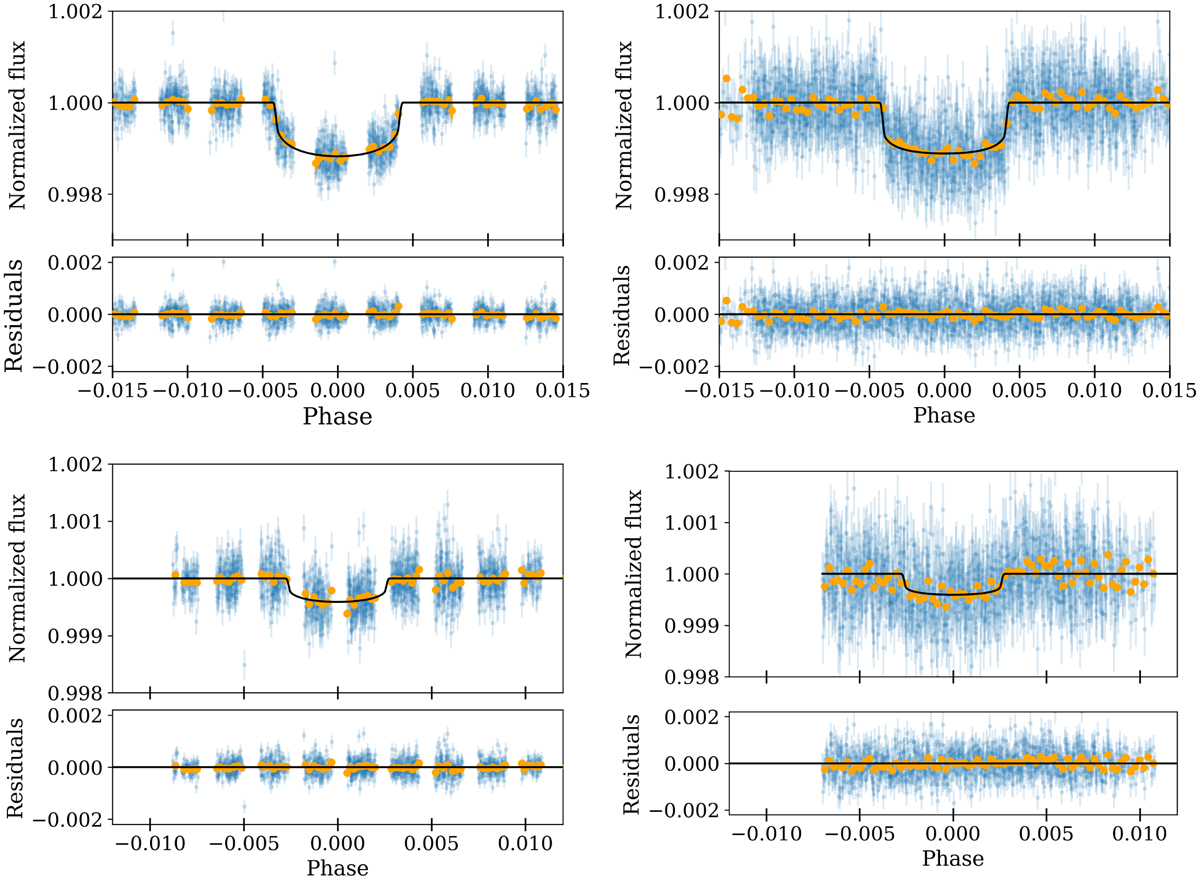
Phased CHEOPS (left) and TESS (right) light curves (blue dots) and its 10-min bins (yellow points). The best transit models (solid black curves) for planet e (top) and f (bottom) obtained in the global analysis of the data. Same details as in Fig. 1.
Current usage metrics show cumulative count of Article Views (full-text article views including HTML views, PDF and ePub downloads, according to the available data) and Abstracts Views on Vision4Press platform.
Data correspond to usage on the plateform after 2015. The current usage metrics is available 48-96 hours after online publication and is updated daily on week days.
Initial download of the metrics may take a while.