Open Access
Fig. F.1
Download original image
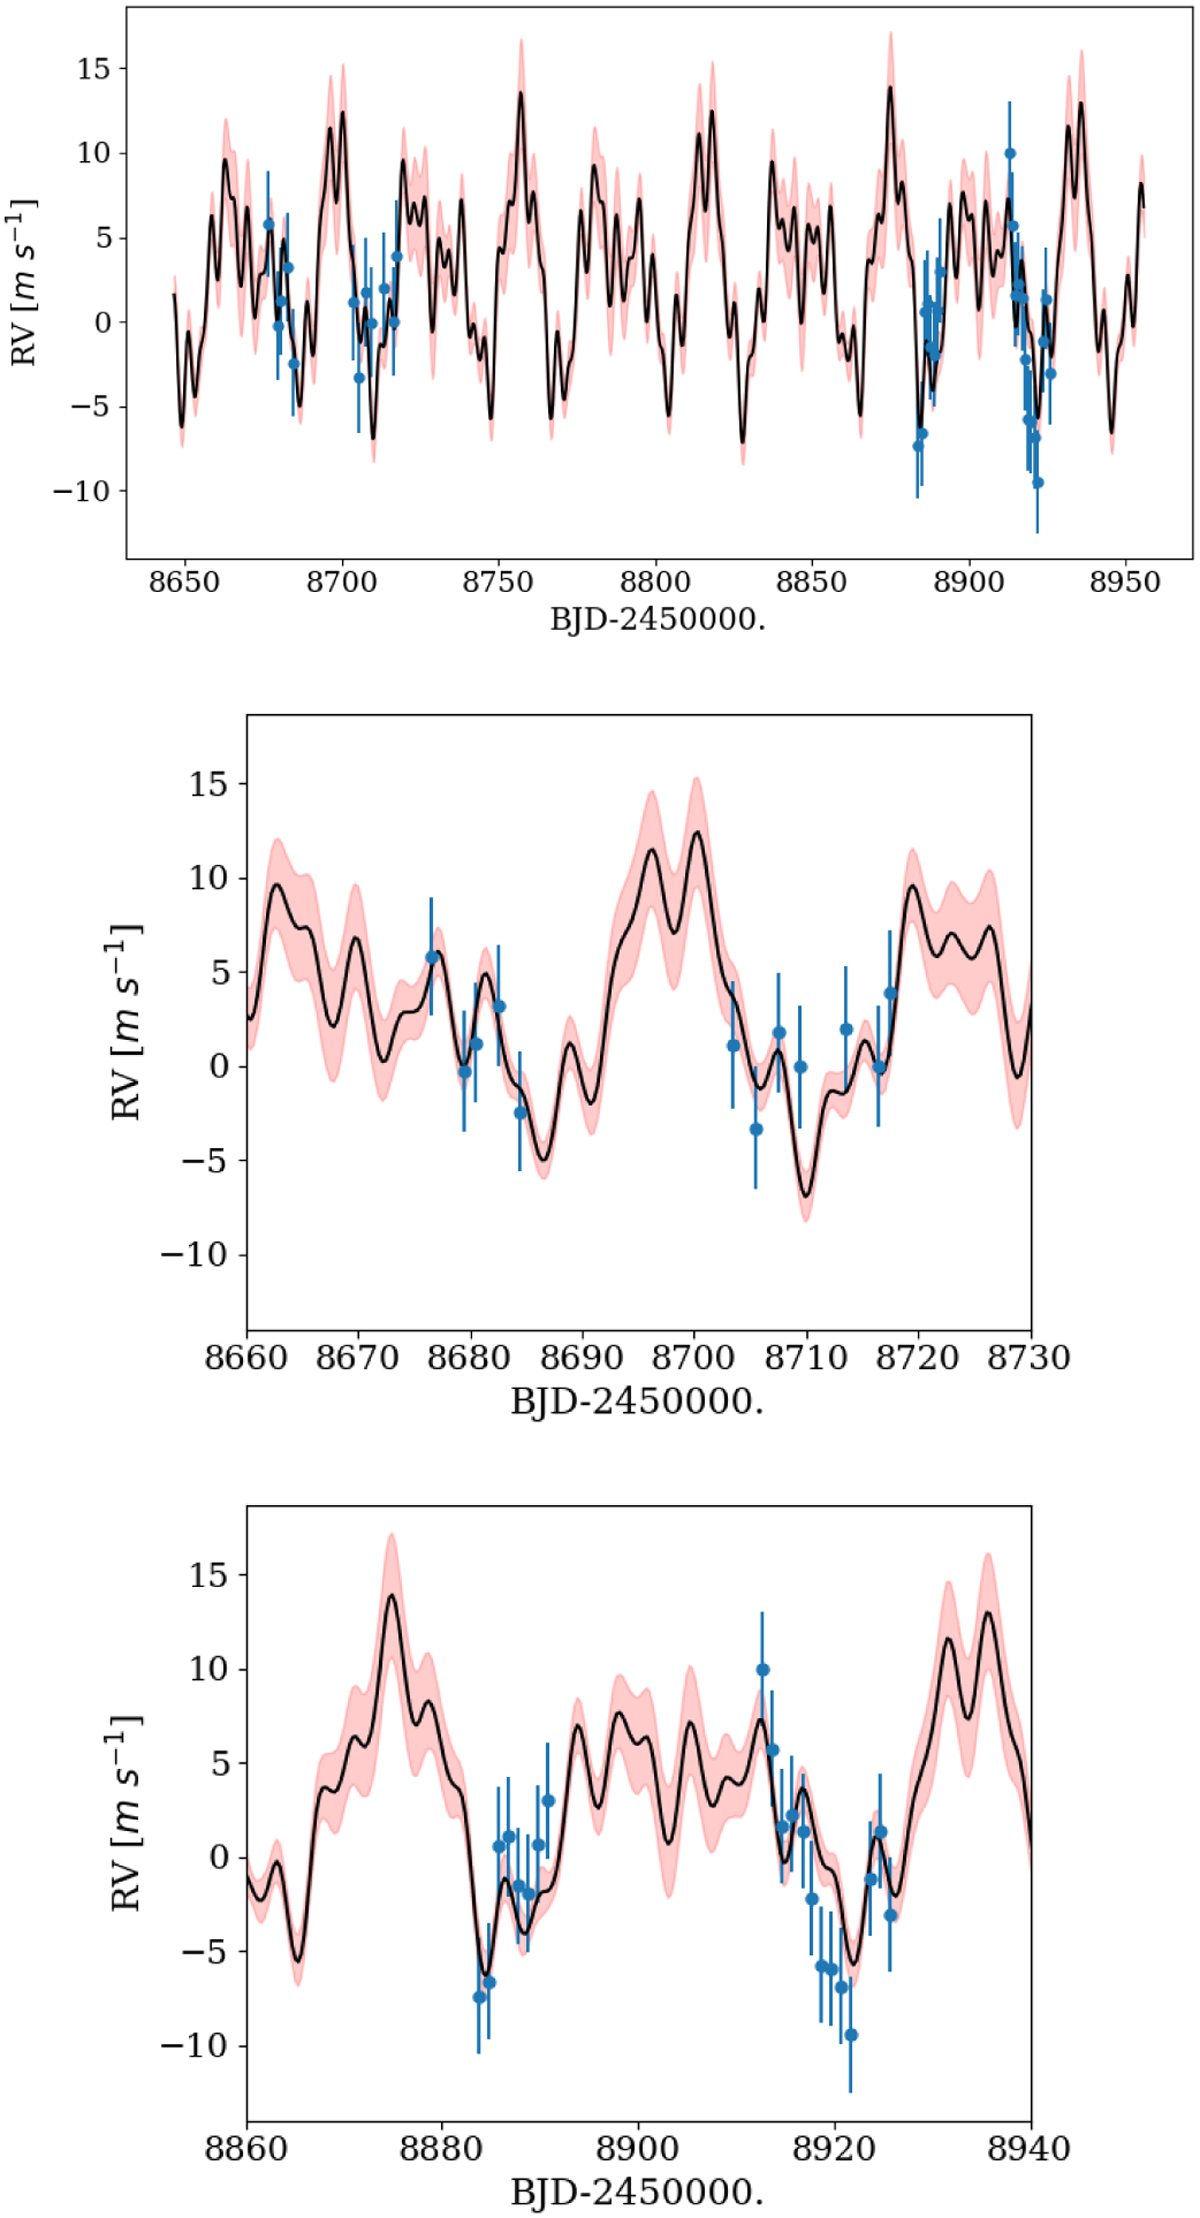
Radial velocity measurements from Teske et al. (2021) (blue symbols) with the best fitted model (black solid curve) and its uncertainties (red regions). The bottom panels are closer views of the top panel for the relevant time coverage of the observations. The RV error bars include the estimated jitter.
Current usage metrics show cumulative count of Article Views (full-text article views including HTML views, PDF and ePub downloads, according to the available data) and Abstracts Views on Vision4Press platform.
Data correspond to usage on the plateform after 2015. The current usage metrics is available 48-96 hours after online publication and is updated daily on week days.
Initial download of the metrics may take a while.