Open Access
Fig. A.3
Download original image
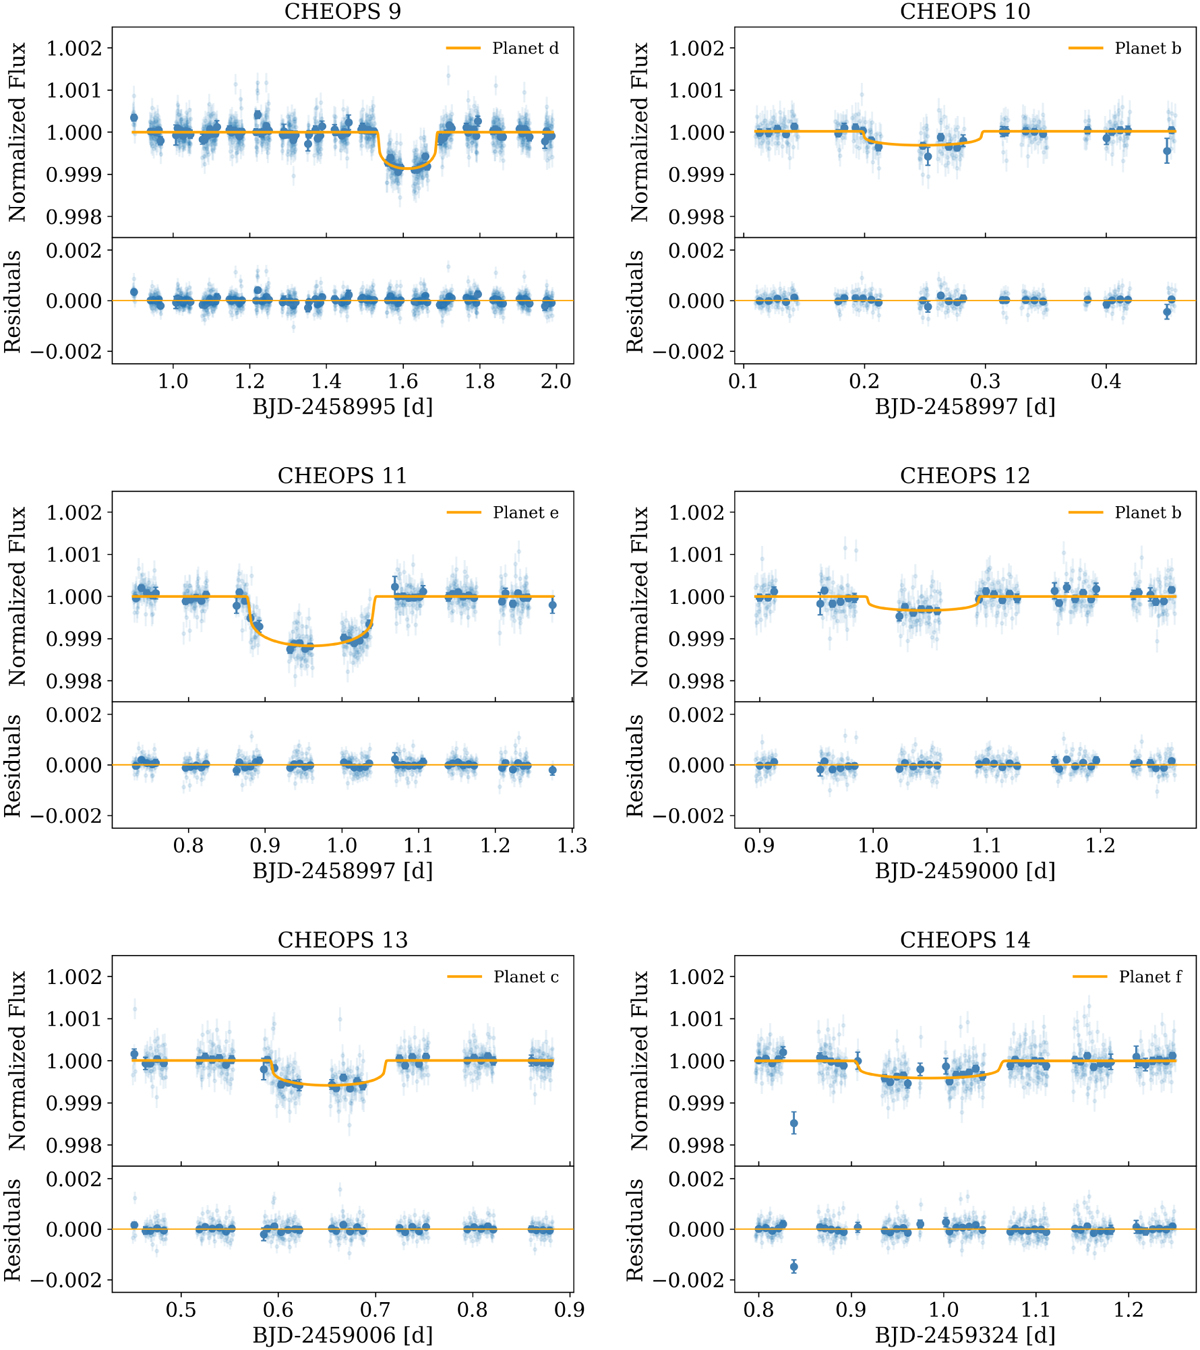
Normalized CHEOPS detrended light curves of HD 108236 used in this work and its 10 min bins are shown, respectively, with light and dark blue symbols. The best transit models obtained from the global analysis of the system are represented by the yellow curve. The residuals are shown in the bottom panels.
Current usage metrics show cumulative count of Article Views (full-text article views including HTML views, PDF and ePub downloads, according to the available data) and Abstracts Views on Vision4Press platform.
Data correspond to usage on the plateform after 2015. The current usage metrics is available 48-96 hours after online publication and is updated daily on week days.
Initial download of the metrics may take a while.