Fig. 5
Download original image
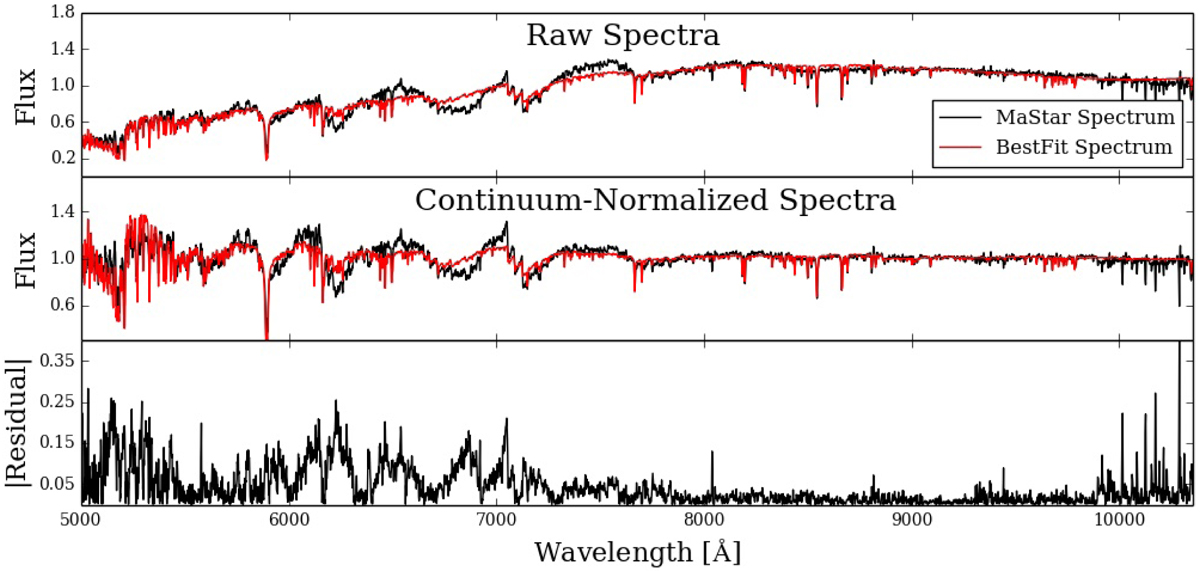
Example of a cool dwarf spectrum with prominent TiO bands below 7800 Å, which our model set struggled to represent accurately. The raw spectrum, along with its corresponding BestFit model, is displayed in the top panel. The continuum-normalized spectrum and model are displayed in the middle panel. The absolute residuals from this fit are shown in the bottom panel, and show significantly better agreement in the 7800–9900 Å range.
Current usage metrics show cumulative count of Article Views (full-text article views including HTML views, PDF and ePub downloads, according to the available data) and Abstracts Views on Vision4Press platform.
Data correspond to usage on the plateform after 2015. The current usage metrics is available 48-96 hours after online publication and is updated daily on week days.
Initial download of the metrics may take a while.