Fig. 20
Download original image
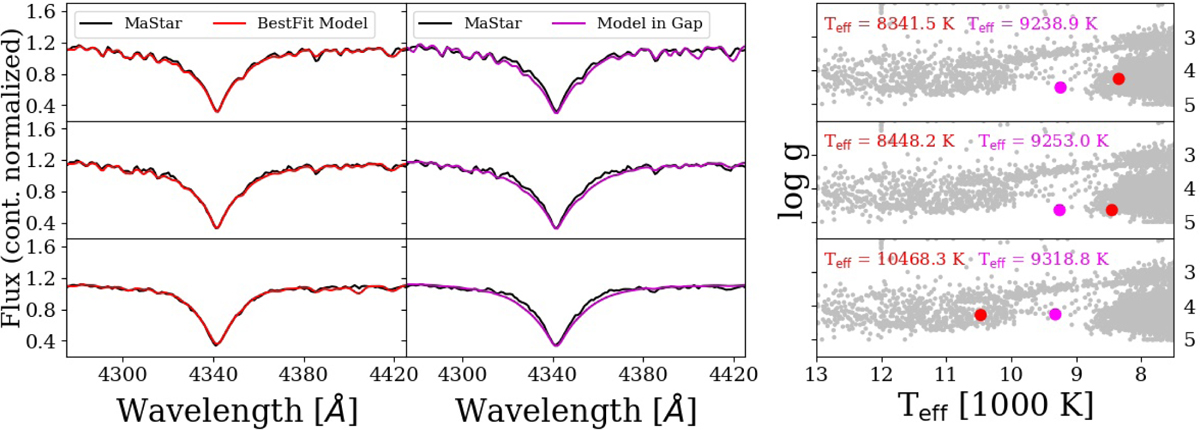
Several examples showing the performance of our narrow-band fitting of Hγ for the BestFit parameter solution (shown in red) compared with the Hγ line profile of an alternate model generated using a temperature computed based on Gaia GBP − GRP color (shown in magenta). Both sets of model spectra are compared with the original MaStar spectrum shown in black. The relative position in parameter space of each model is shown in the three panels on the right.
Current usage metrics show cumulative count of Article Views (full-text article views including HTML views, PDF and ePub downloads, according to the available data) and Abstracts Views on Vision4Press platform.
Data correspond to usage on the plateform after 2015. The current usage metrics is available 48-96 hours after online publication and is updated daily on week days.
Initial download of the metrics may take a while.