Fig. 19
Download original image
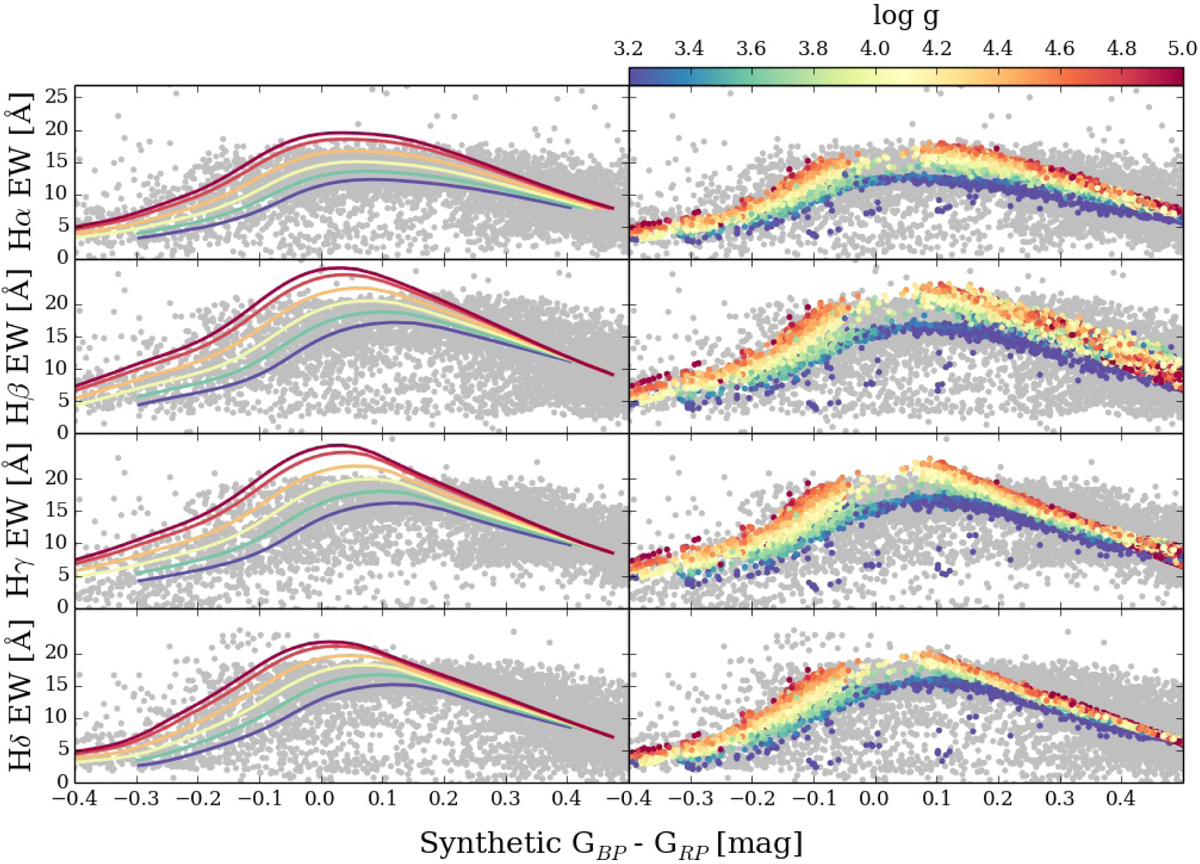
The relationship between the equivalent width (EW) of the first four Balmer lines and Gaia GBP − GRP color for both the original model grid (left, represented by solid curves) and the interpolated BestFit models corresponding to each MaStar spectrum (right, represented by points color-coded by log g). The EW-color distribution of the set of MaStar spectra, with extinction effects removed, is shown in the background of each panel in gray.
Current usage metrics show cumulative count of Article Views (full-text article views including HTML views, PDF and ePub downloads, according to the available data) and Abstracts Views on Vision4Press platform.
Data correspond to usage on the plateform after 2015. The current usage metrics is available 48-96 hours after online publication and is updated daily on week days.
Initial download of the metrics may take a while.