Open Access
Fig. 18
Download original image
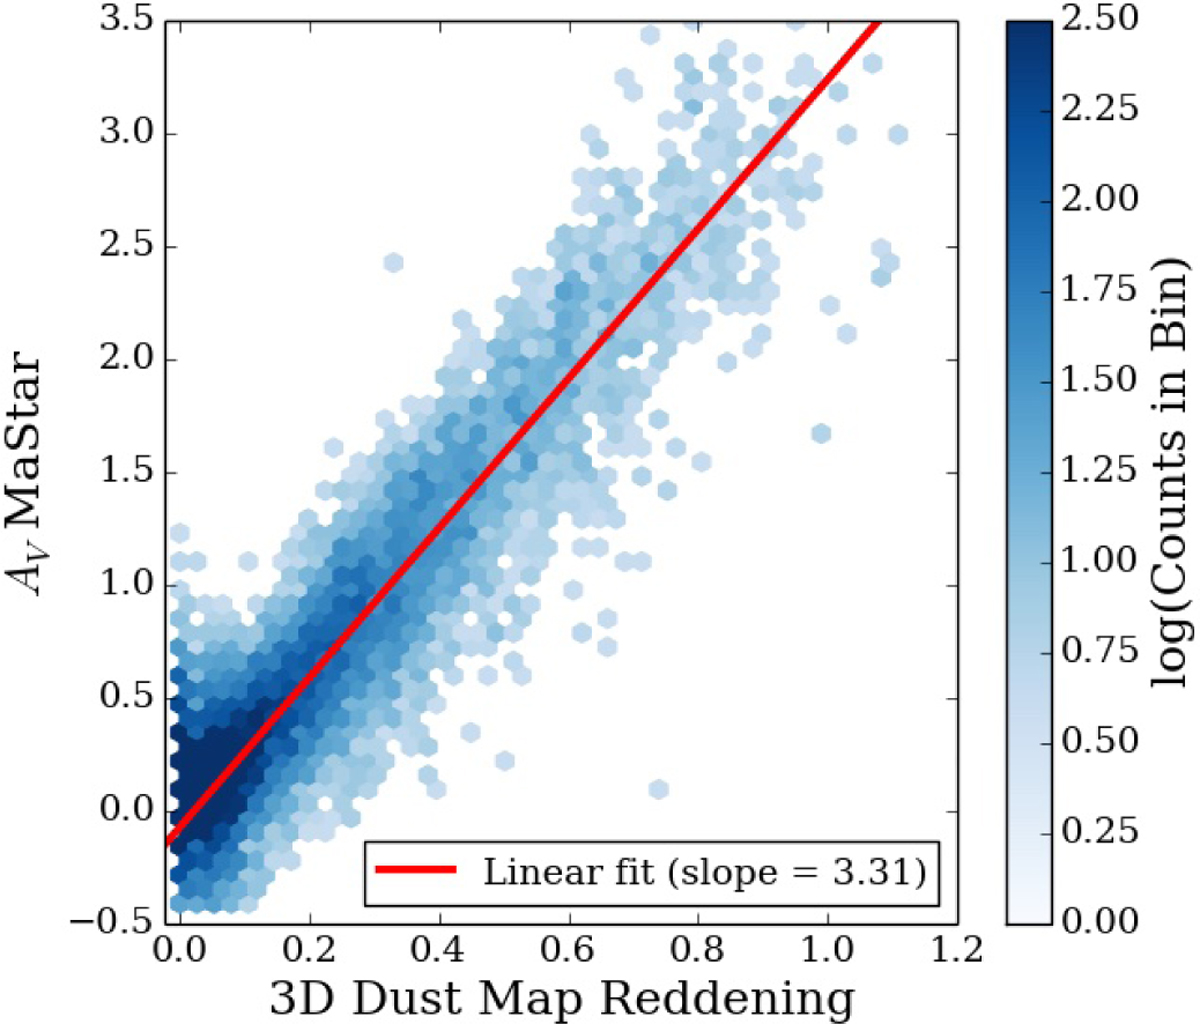
Distribution of MaStar AV estimates compared with reddening measurements based on 3D dust maps following quality cuts. Spectra with AV,error > 0.005 have been excluded from this distribution. The new corresponding linear fit is shown in red.
Current usage metrics show cumulative count of Article Views (full-text article views including HTML views, PDF and ePub downloads, according to the available data) and Abstracts Views on Vision4Press platform.
Data correspond to usage on the plateform after 2015. The current usage metrics is available 48-96 hours after online publication and is updated daily on week days.
Initial download of the metrics may take a while.