Open Access
Fig. 16
Download original image
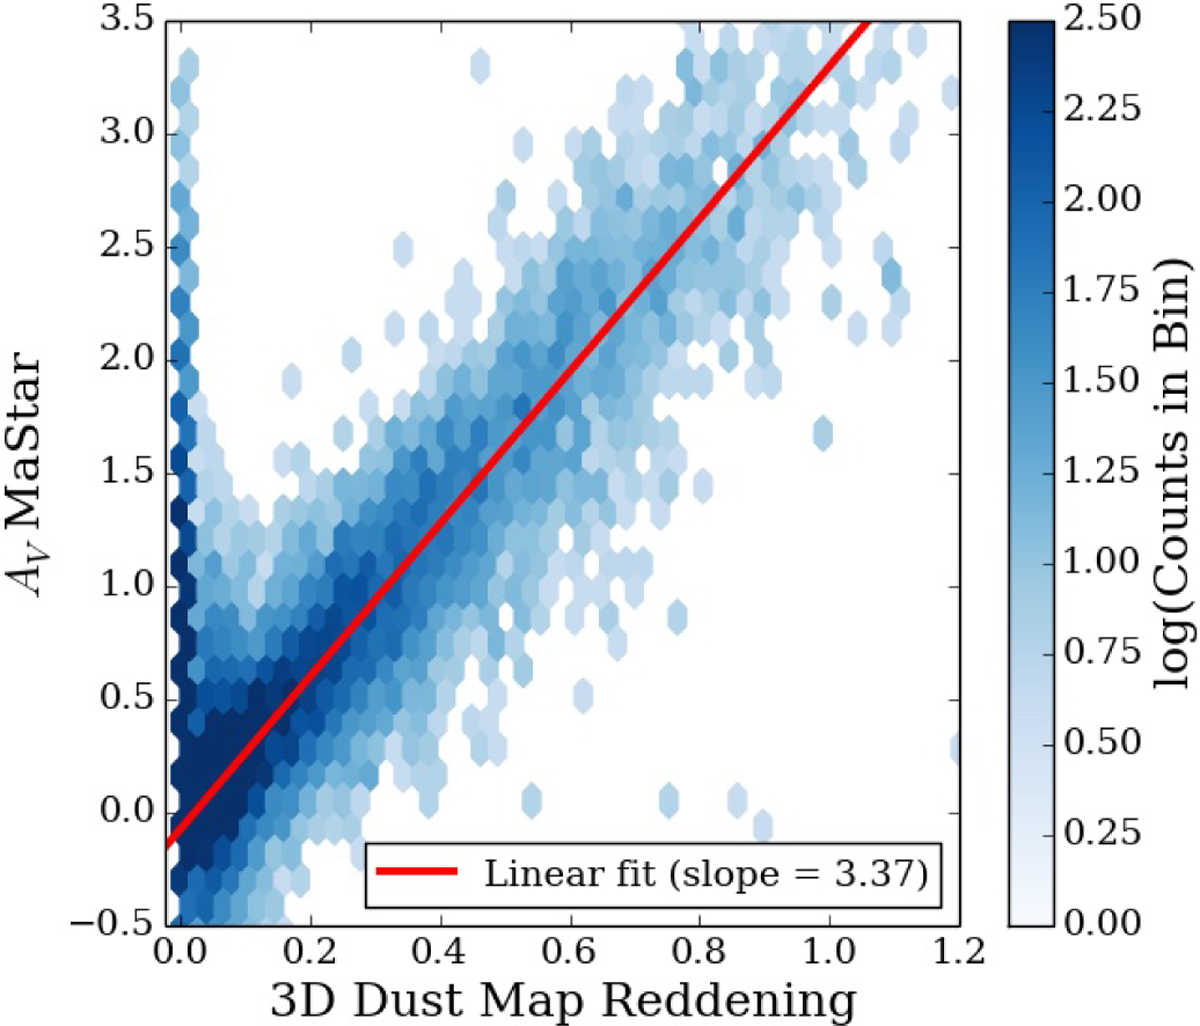
Distribution of MaStar AV estimates compared with reddening measurements prior to quality cuts. Reddening estimates were made using recent 3D dust maps combined with Bailer-Jones distance estimates, and are given as the arbitrary reddening coefficient E. The corresponding linear fit is shown in red.
Current usage metrics show cumulative count of Article Views (full-text article views including HTML views, PDF and ePub downloads, according to the available data) and Abstracts Views on Vision4Press platform.
Data correspond to usage on the plateform after 2015. The current usage metrics is available 48-96 hours after online publication and is updated daily on week days.
Initial download of the metrics may take a while.