Fig. 11
Download original image
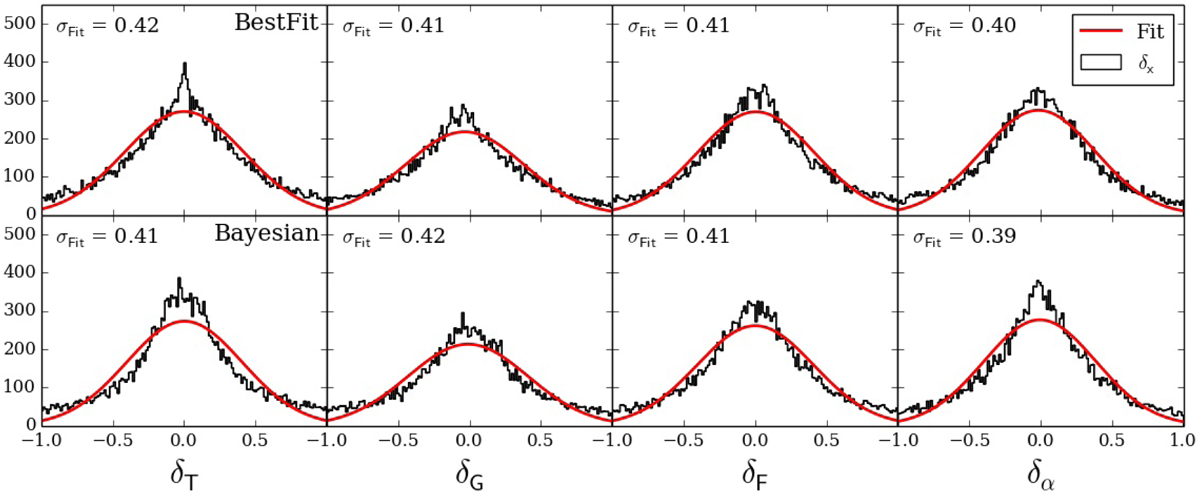
Histograms showing the distribution of ![]() for parameters Teff, log g, [Fe/H], and [α/Fe] (abbreviated as T, G, F, and α for simplicity).
for parameters Teff, log g, [Fe/H], and [α/Fe] (abbreviated as T, G, F, and α for simplicity). ![]() is our preferred metric for evaluating the internal consistency of our error estimates.
is our preferred metric for evaluating the internal consistency of our error estimates. ![]() values corresponding to the BestFit parameters are shown in the top row, and those corresponding to the Bayesian parameters are shown in the bottom row. Cases in which the BestFit parameters fell on the edge of the model grid were excluded from both sets to avoid exaggerating the degree of consistency between visits.
values corresponding to the BestFit parameters are shown in the top row, and those corresponding to the Bayesian parameters are shown in the bottom row. Cases in which the BestFit parameters fell on the edge of the model grid were excluded from both sets to avoid exaggerating the degree of consistency between visits.
Current usage metrics show cumulative count of Article Views (full-text article views including HTML views, PDF and ePub downloads, according to the available data) and Abstracts Views on Vision4Press platform.
Data correspond to usage on the plateform after 2015. The current usage metrics is available 48-96 hours after online publication and is updated daily on week days.
Initial download of the metrics may take a while.