Fig. 9.
Download original image
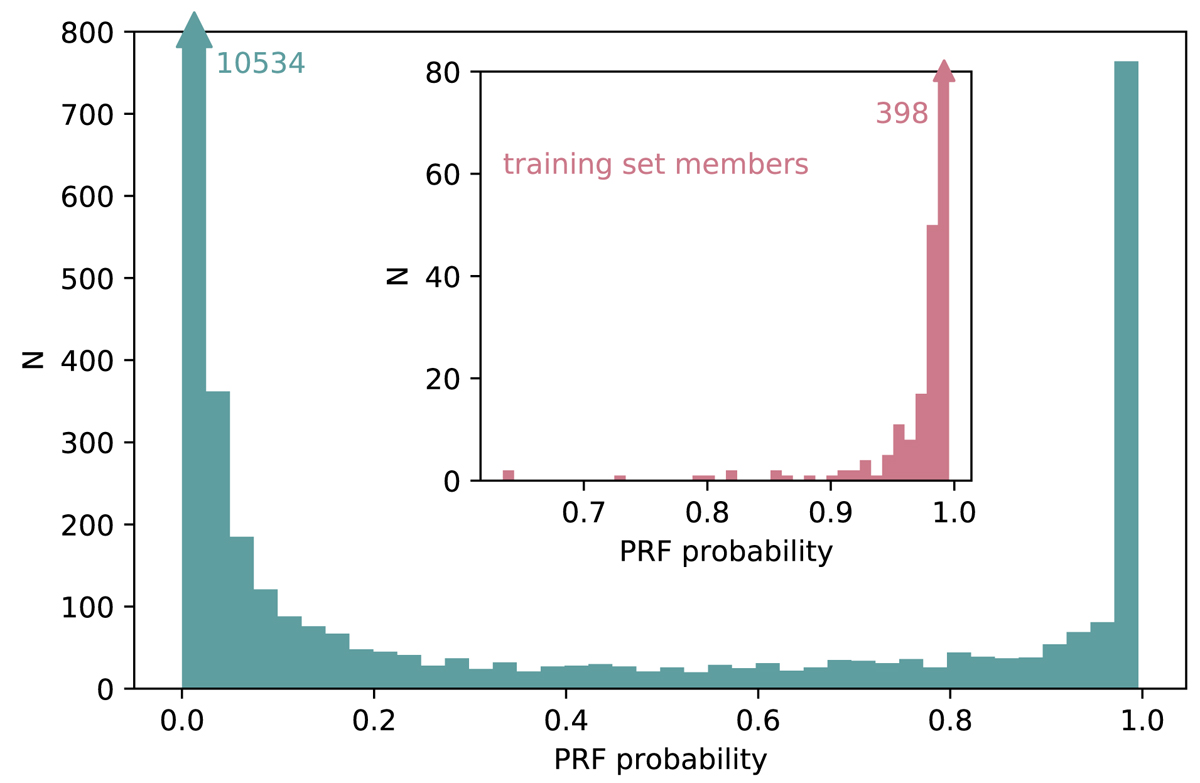
Membership probabilities from the run F1, limited to the objects within 20′ radius from the stars HD 46150 for clarity. The inset histogram is showing the probabilities derived for the objects labelled as members in the training set. In both histograms, the values of the edge bins marked with an arrow extend outside of the plotting range; the corresponding bin values are shown on the plot.
Current usage metrics show cumulative count of Article Views (full-text article views including HTML views, PDF and ePub downloads, according to the available data) and Abstracts Views on Vision4Press platform.
Data correspond to usage on the plateform after 2015. The current usage metrics is available 48-96 hours after online publication and is updated daily on week days.
Initial download of the metrics may take a while.