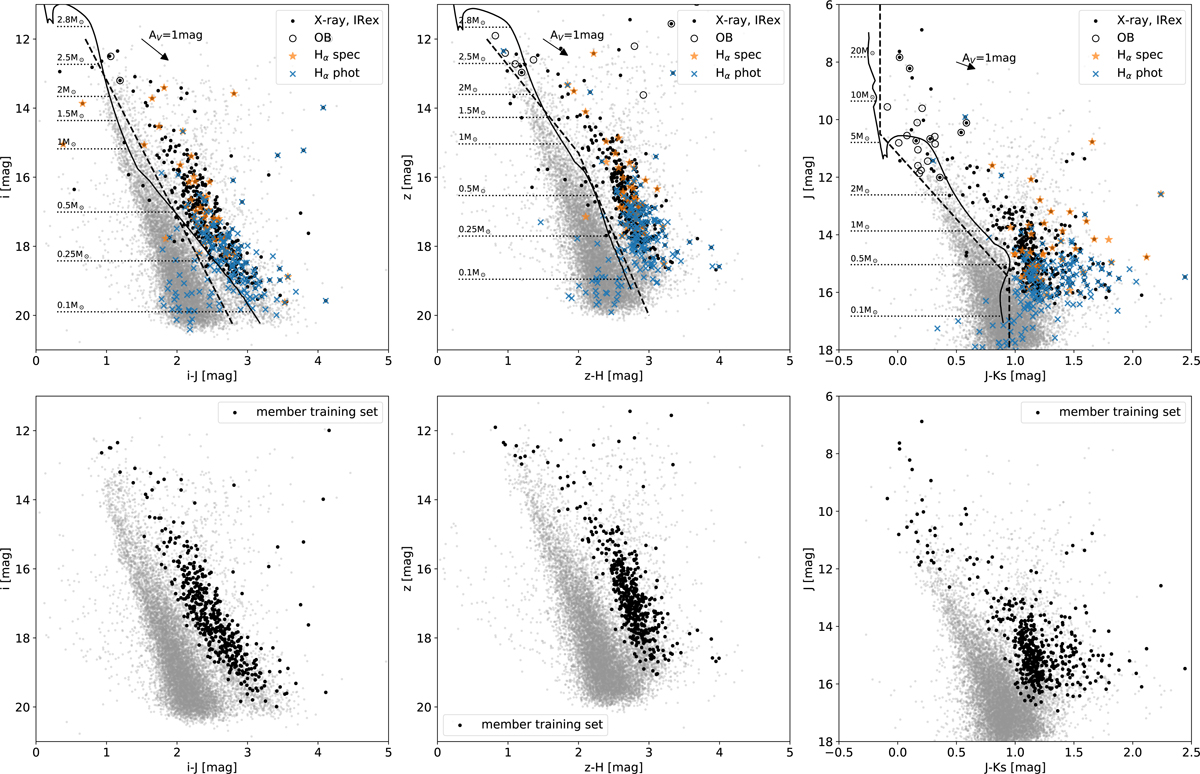
Fig. 7.
Download original image
Colour-magnitude diagrams used for the selection of the member training set. The grey dots in all panels show the full catalogue. Top panels: the proper-motion-selected candidates belonging to various categories (X-ray and IR excess, OB stars, Hα spectroscopy and Hα photometry; see text for details) are overplotted. The solid line shows the 2 Myr PARSEC isochrone, and the dashed lines the selection criteria. Bottom panels: the black points show the 500 finally selected members for the training set, based on the proper motion, colour, and parallax arguments.
Current usage metrics show cumulative count of Article Views (full-text article views including HTML views, PDF and ePub downloads, according to the available data) and Abstracts Views on Vision4Press platform.
Data correspond to usage on the plateform after 2015. The current usage metrics is available 48-96 hours after online publication and is updated daily on week days.
Initial download of the metrics may take a while.