Fig. 6.
Download original image
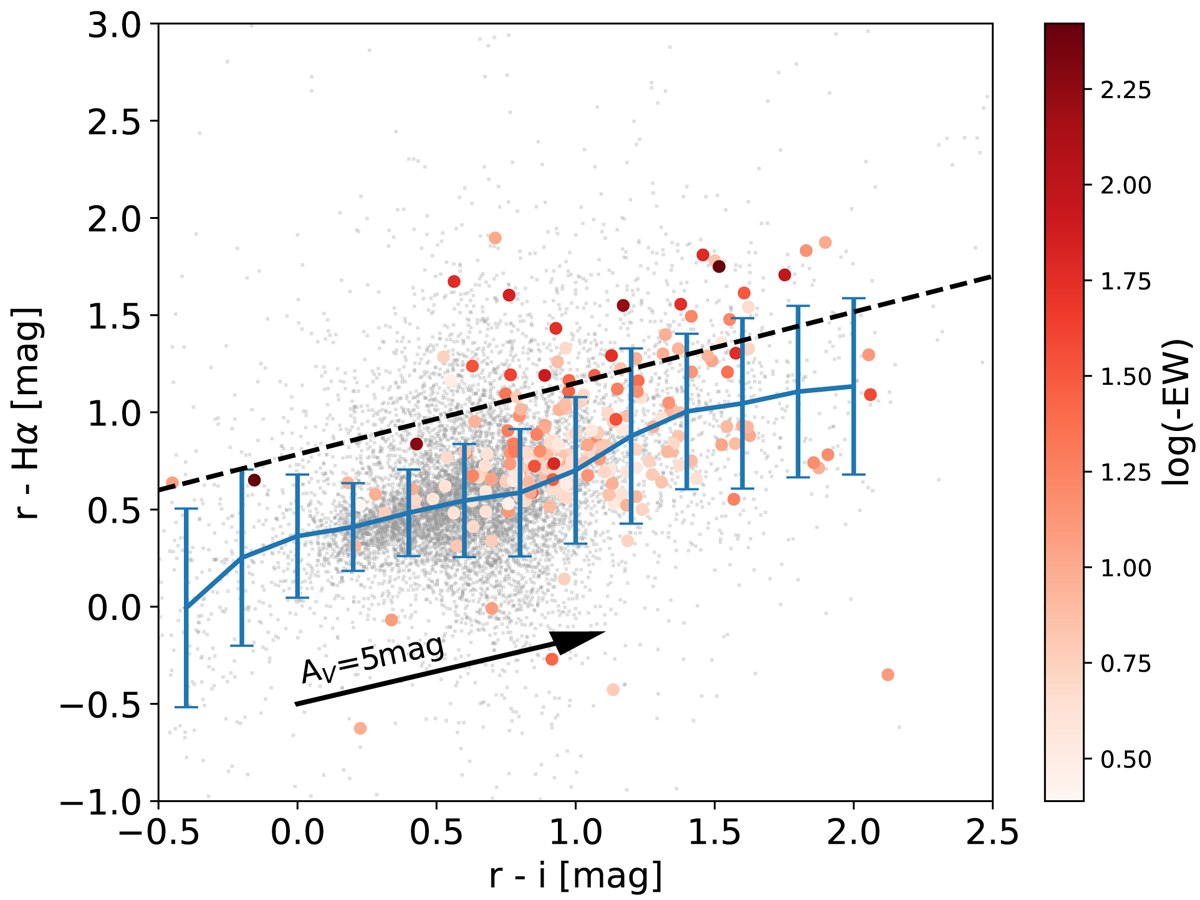
r − i, r − Hα CMD showing all the sources in the field (grey dots), along with their mean colours and corresponding standard deviations (blue). The red-scale points show the colours of stars with measured pEWs from spectroscopy, coloured by its value. The sources above the black dashed line are selected as potential member candidates due to an enhanced Hα emission. This selection is further refined using the proper motions and position in CMDs.
Current usage metrics show cumulative count of Article Views (full-text article views including HTML views, PDF and ePub downloads, according to the available data) and Abstracts Views on Vision4Press platform.
Data correspond to usage on the plateform after 2015. The current usage metrics is available 48-96 hours after online publication and is updated daily on week days.
Initial download of the metrics may take a while.