Fig. 4.
Download original image
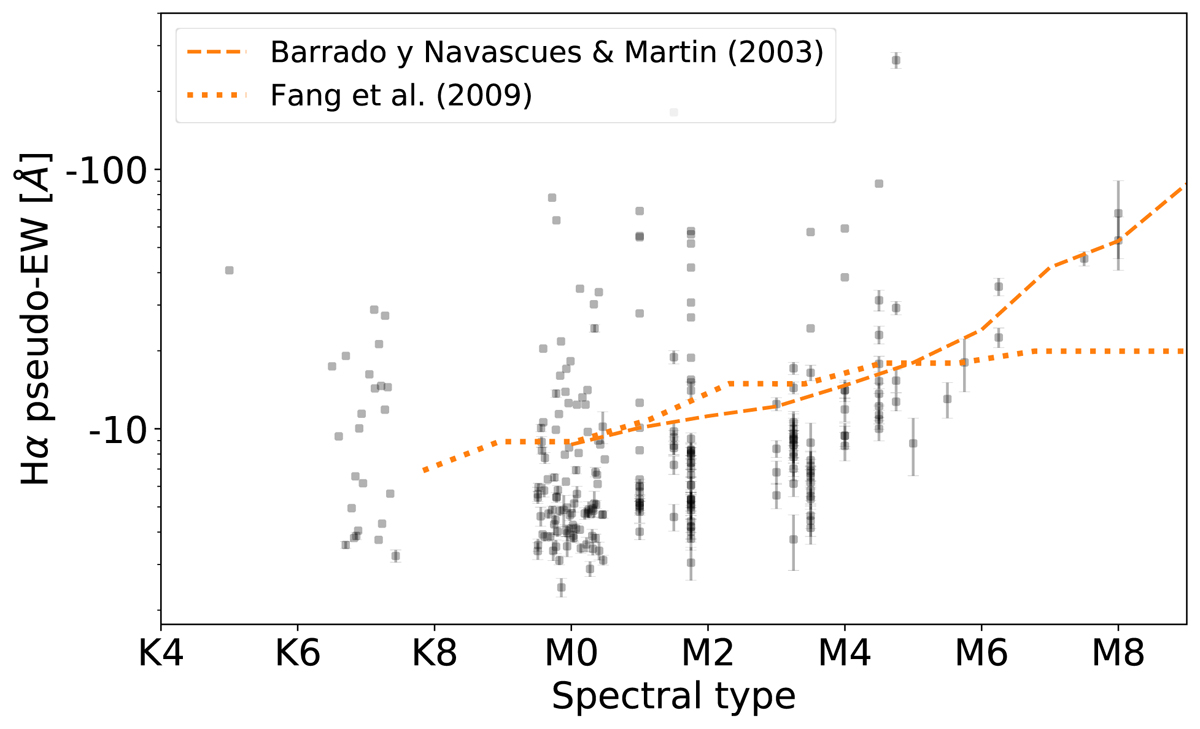
Hα pseudo-EWs as a function of spectral type obtained from the VIMOS spectra. The dashed and the dotted orange lines represent the accretion thresholds defined by Barrado y Navascués & Martín (2003) and Fang et al. (2009), respectively. The sources with the SpT K7 and M0 have been randomly displaced within (SpT-0.5, SpT+0.5), for clarity. The error bars are shown only when they are larger than the plotting symbols.
Current usage metrics show cumulative count of Article Views (full-text article views including HTML views, PDF and ePub downloads, according to the available data) and Abstracts Views on Vision4Press platform.
Data correspond to usage on the plateform after 2015. The current usage metrics is available 48-96 hours after online publication and is updated daily on week days.
Initial download of the metrics may take a while.