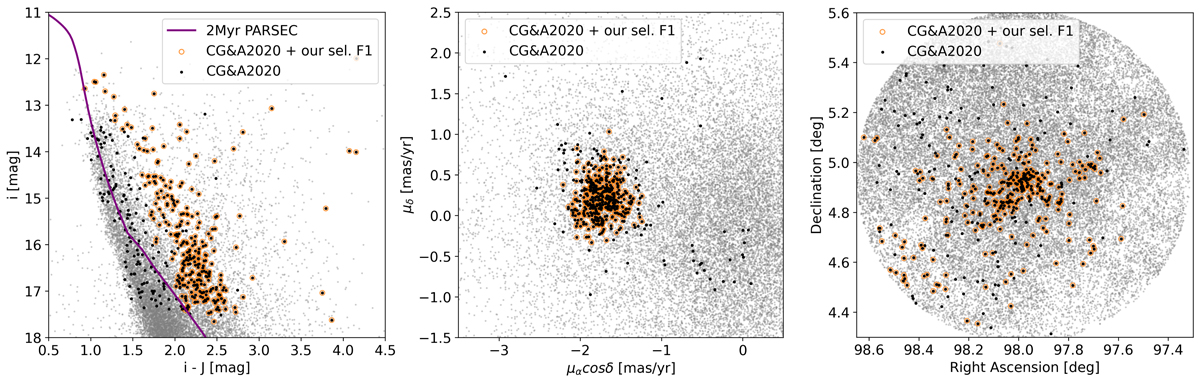
Fig. F.1.
Download original image
Colour-magnitude diagram (left), proper motions (middle), and the positions on the sky (right) for all the sources featuring in our initial catalogue, located within 45′ from the star HD 46150 (small grey dots). Candidates with membership probability > 70% from Cantat-Gaudin & Anders (2020) are shown as black dots, and those that pass also our selection (F1, membership probability > 80%) as orange open circles. We estimate that there may be as much as 35% of contaminants in the selection sample of Cantat-Gaudin & Anders (2020).
Current usage metrics show cumulative count of Article Views (full-text article views including HTML views, PDF and ePub downloads, according to the available data) and Abstracts Views on Vision4Press platform.
Data correspond to usage on the plateform after 2015. The current usage metrics is available 48-96 hours after online publication and is updated daily on week days.
Initial download of the metrics may take a while.