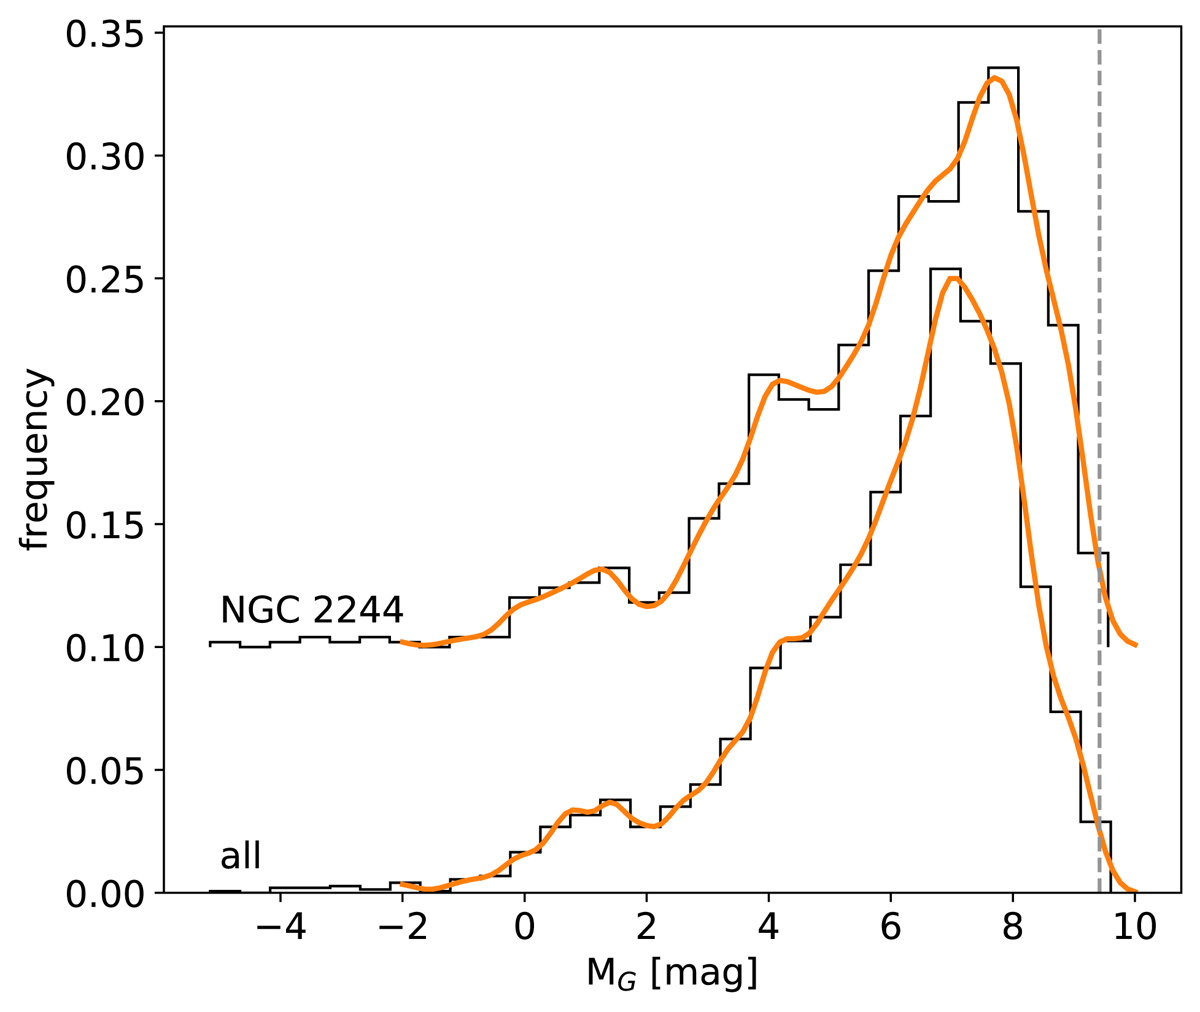
Fig. 17.
Download original image
Luminosity function in Gaia G-band for the probable members in the entire studied region (run F1; bottom histogram), and only for NGC 2244 (within the cluster radius of r = 18′, excluding the probable members of NGC 2237; top histogram). The orange lines represent KDE distributions calculated with Silverman rule bandwidth. The upper distribution is shifted vertically by 0.1 for clarity. The completeness limit of the Gaia G-band with the distance modulus subtracted is shown as a vertical dashed line.
Current usage metrics show cumulative count of Article Views (full-text article views including HTML views, PDF and ePub downloads, according to the available data) and Abstracts Views on Vision4Press platform.
Data correspond to usage on the plateform after 2015. The current usage metrics is available 48-96 hours after online publication and is updated daily on week days.
Initial download of the metrics may take a while.