Fig. 16.
Download original image
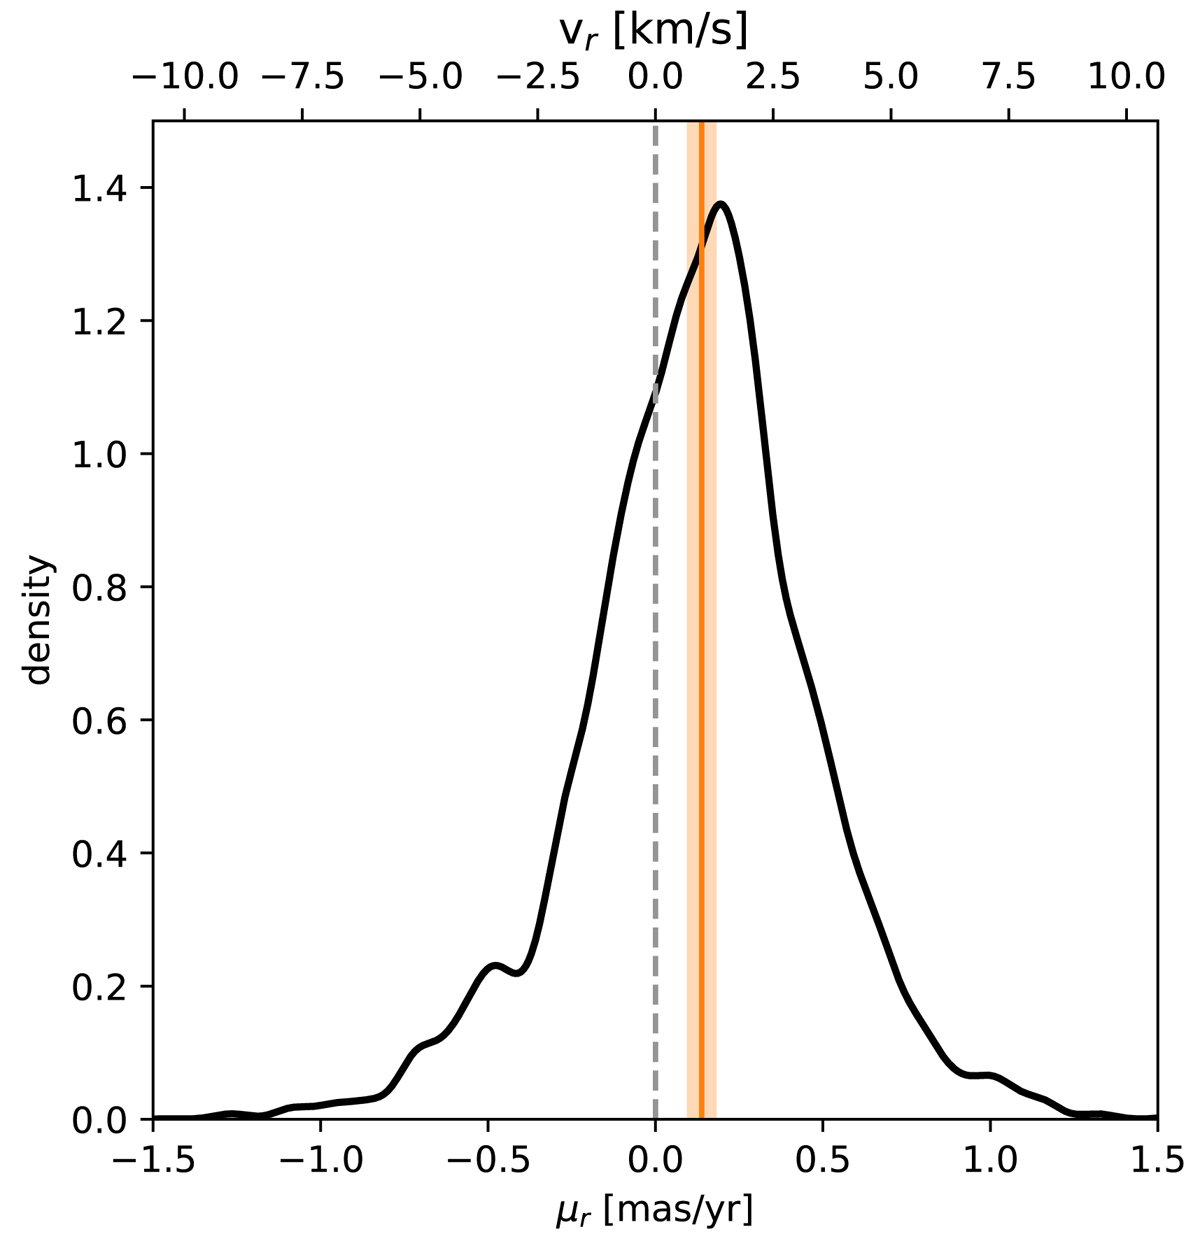
Distribution of the radial component of the relative proper motions for the stars within the 18′ radius from the centre of NGC 2244 (shown as a KDE plot). The grey dashed line indicates the zero velocity, the solid orange line the median of the distribution, and the shaded orange region indicates the 3σ uncertainty on the median. The values on the top axis assume a distance of 1500 pc.
Current usage metrics show cumulative count of Article Views (full-text article views including HTML views, PDF and ePub downloads, according to the available data) and Abstracts Views on Vision4Press platform.
Data correspond to usage on the plateform after 2015. The current usage metrics is available 48-96 hours after online publication and is updated daily on week days.
Initial download of the metrics may take a while.