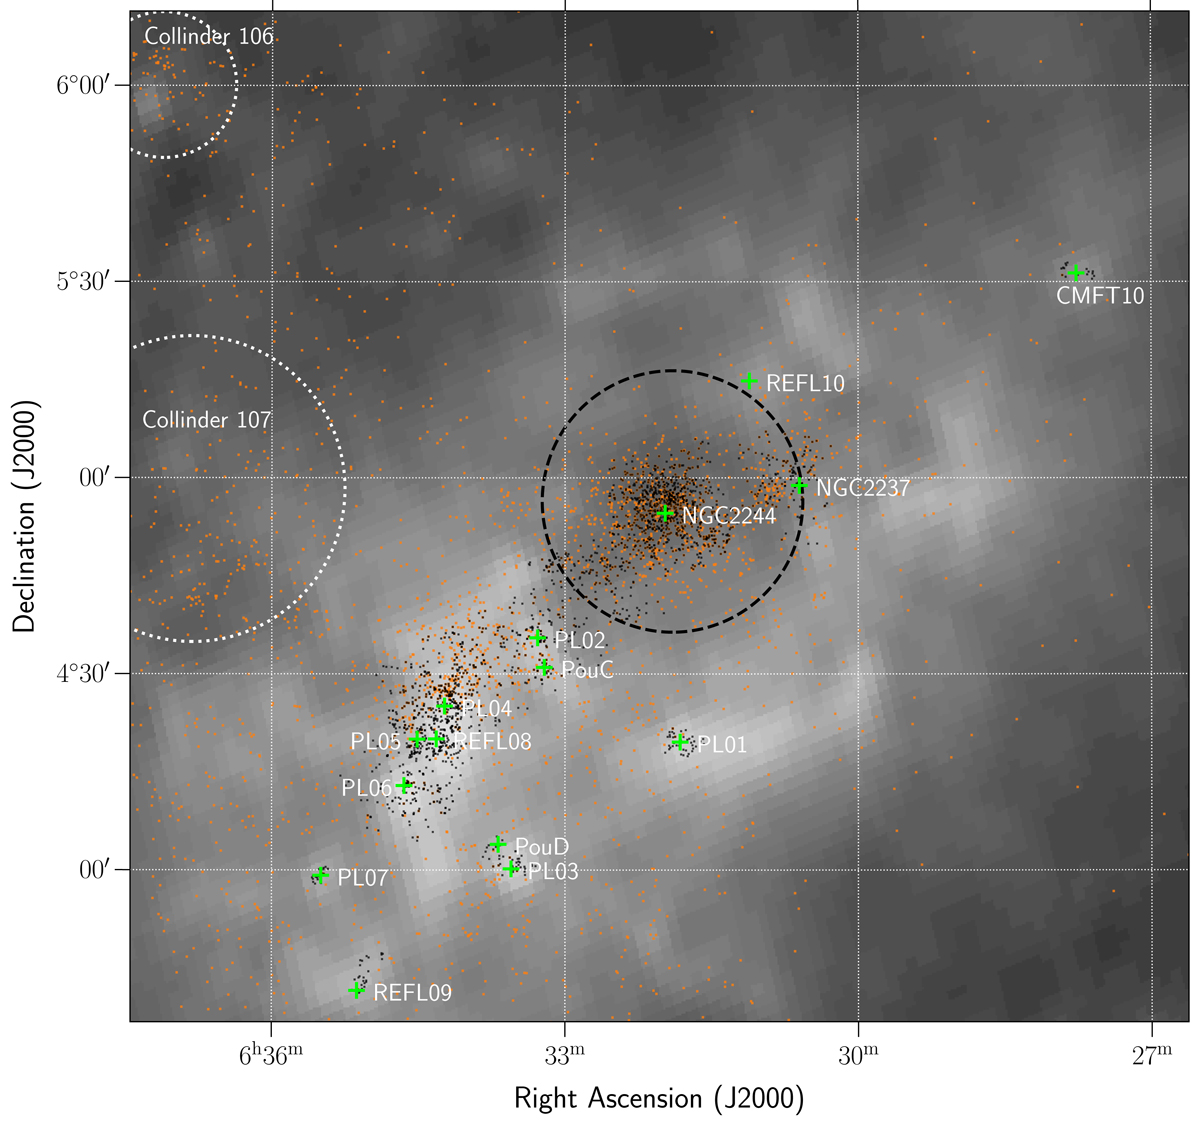
Fig. 10.
Download original image
Planck 857 GHz image of the studied region, along with the candidates with membership probabilities ≥80% from the run F1 (orange dots), and the mid-infrared and X-ray selected YSOs from Broos et al. (2013) and Cambrésy et al. (2013, black dots). The black circle marks the 20′ (∼8.7 pc) radius from the brightest star in the field where the training sample has been selected. Green crosses mark the positions of the young clusters and groups identified in Phelps & Lada (1997), Roman-Zuniga (2006), Poulton et al. (2008), Cambrésy et al. (2013). The dotted white circles are centred at the central positions of the clusters Collinder 106 and 107, with the radii containing half the members, as given in Cantat-Gaudin & Anders (2020).
Current usage metrics show cumulative count of Article Views (full-text article views including HTML views, PDF and ePub downloads, according to the available data) and Abstracts Views on Vision4Press platform.
Data correspond to usage on the plateform after 2015. The current usage metrics is available 48-96 hours after online publication and is updated daily on week days.
Initial download of the metrics may take a while.