Open Access
Fig. 4
Download original image
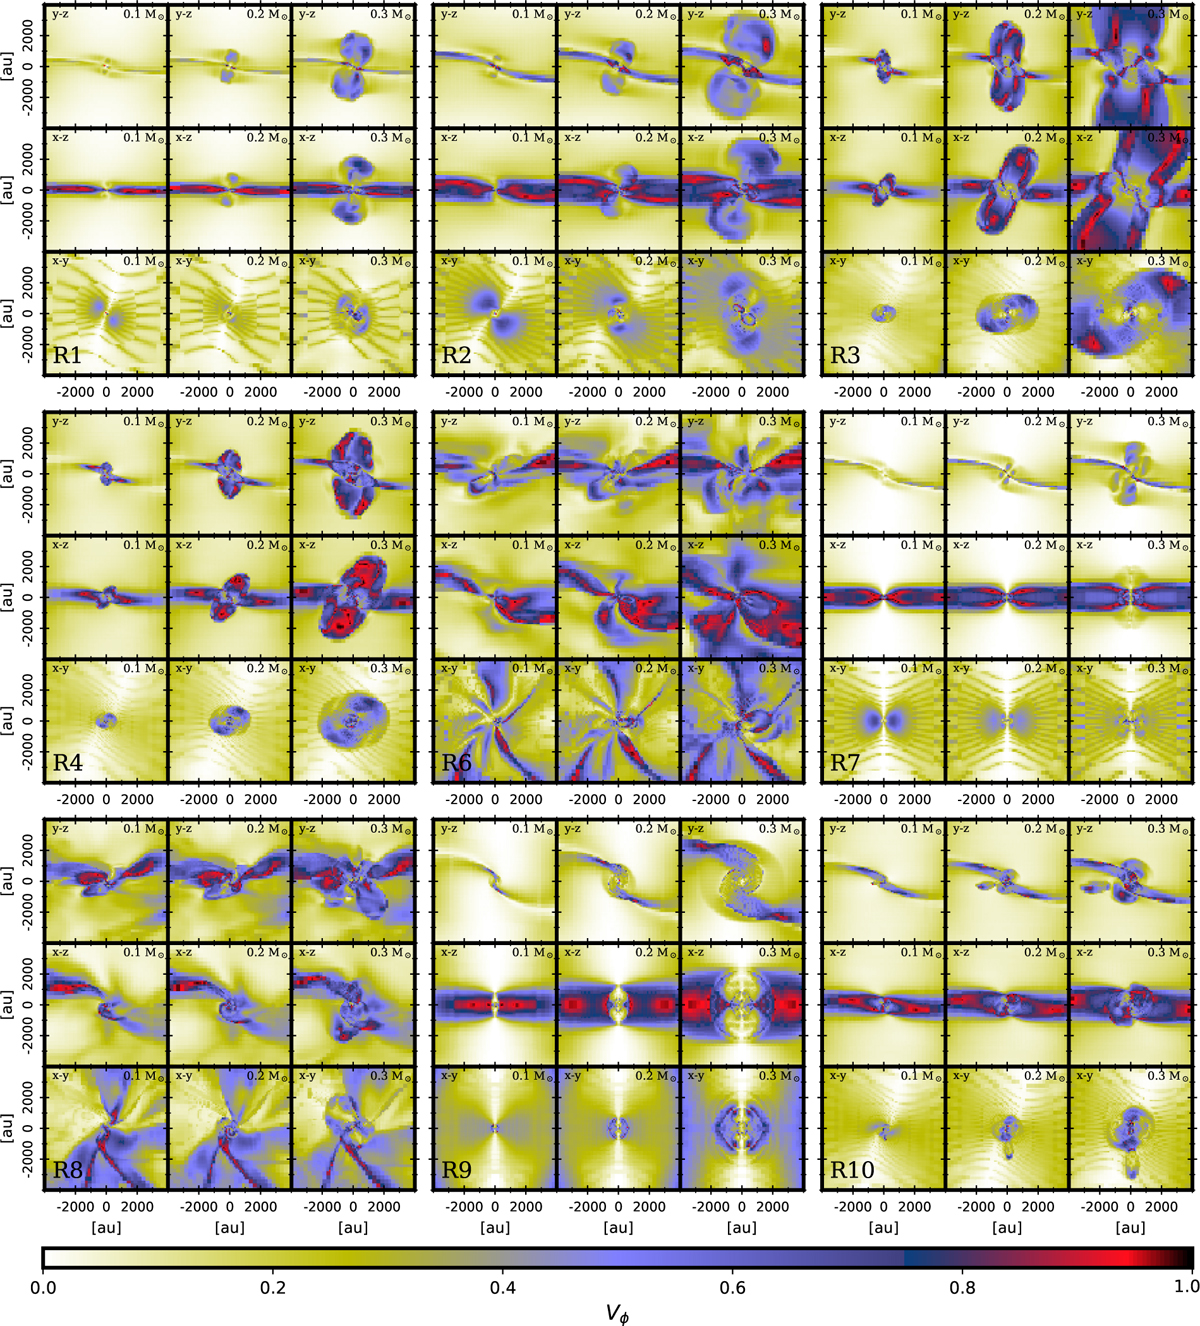
Circular variance Vϕ of the B-fleld lines in the RAMSES data cubes (See Sect. 2.3). The figure is organized using the same structure as in Figs. 2 and 3. The simulation identifier is given in the bottom left corner of the block, while the projection and evolutionary step are shown at the top of each individual plot.
Current usage metrics show cumulative count of Article Views (full-text article views including HTML views, PDF and ePub downloads, according to the available data) and Abstracts Views on Vision4Press platform.
Data correspond to usage on the plateform after 2015. The current usage metrics is available 48-96 hours after online publication and is updated daily on week days.
Initial download of the metrics may take a while.