Open Access
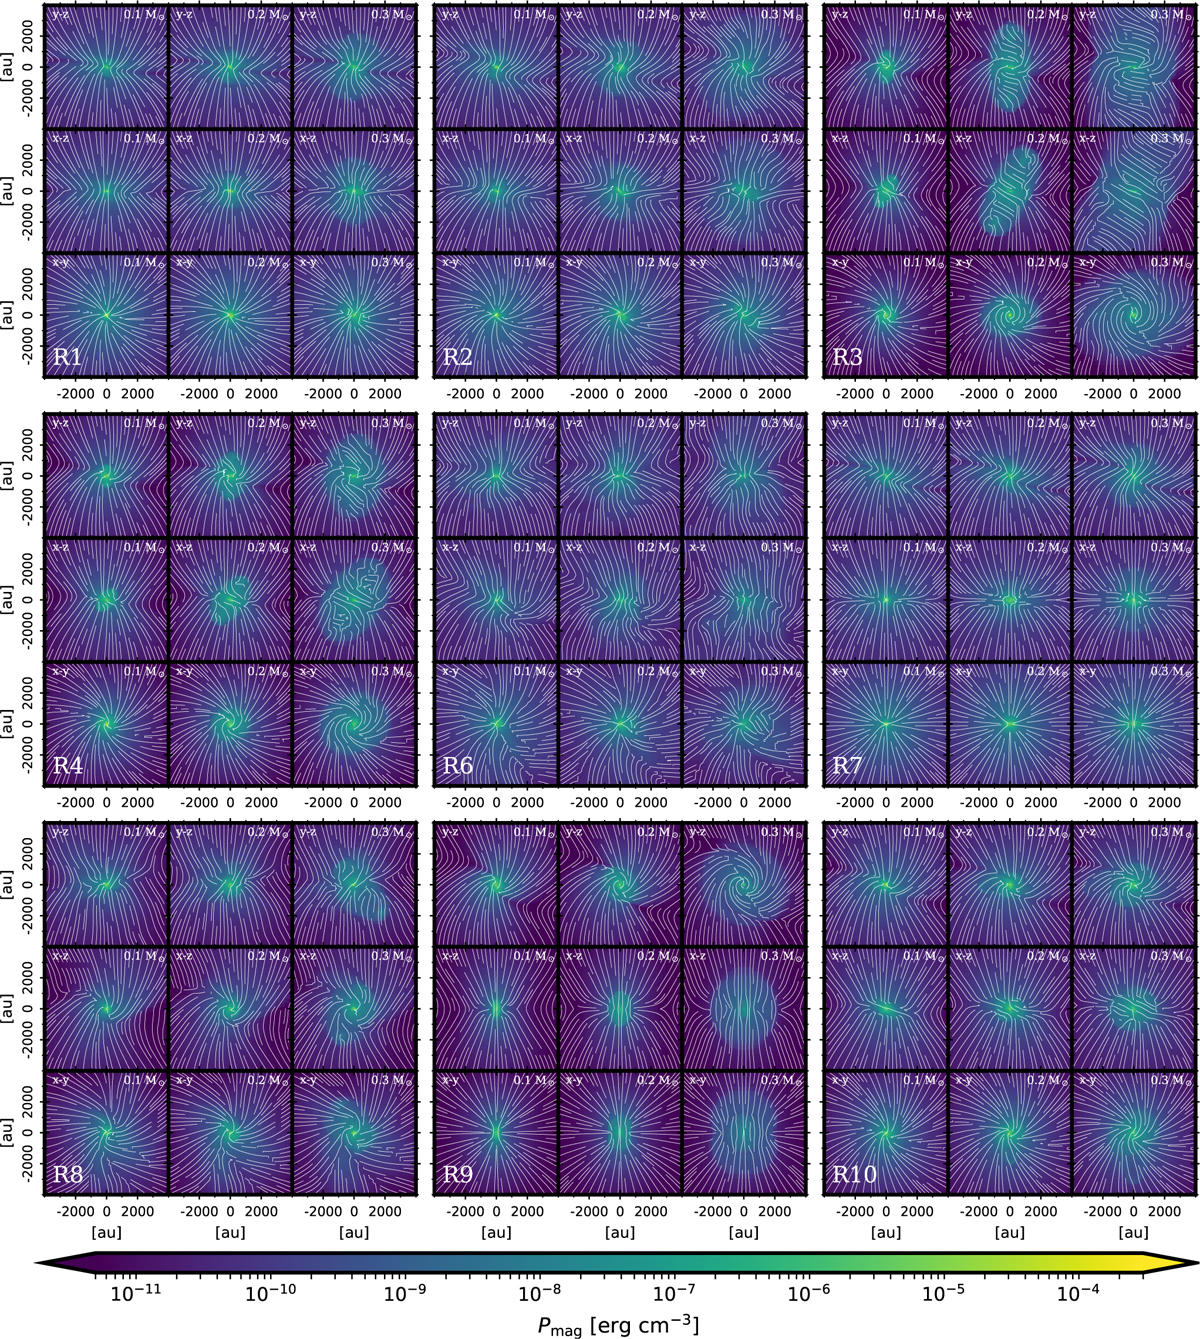
Fig. 3
Download original image
Mean magnetic pressure Pmag maps and the orientation of the magnetic field lines along each projection for all the simulations. Each block corresponds to a given simulation and the plots are organized using the same structure as in Fig. 2. Higher resolution figures for individual simulations are available online.
Current usage metrics show cumulative count of Article Views (full-text article views including HTML views, PDF and ePub downloads, according to the available data) and Abstracts Views on Vision4Press platform.
Data correspond to usage on the plateform after 2015. The current usage metrics is available 48-96 hours after online publication and is updated daily on week days.
Initial download of the metrics may take a while.