Open Access
Fig. B.1
Download original image
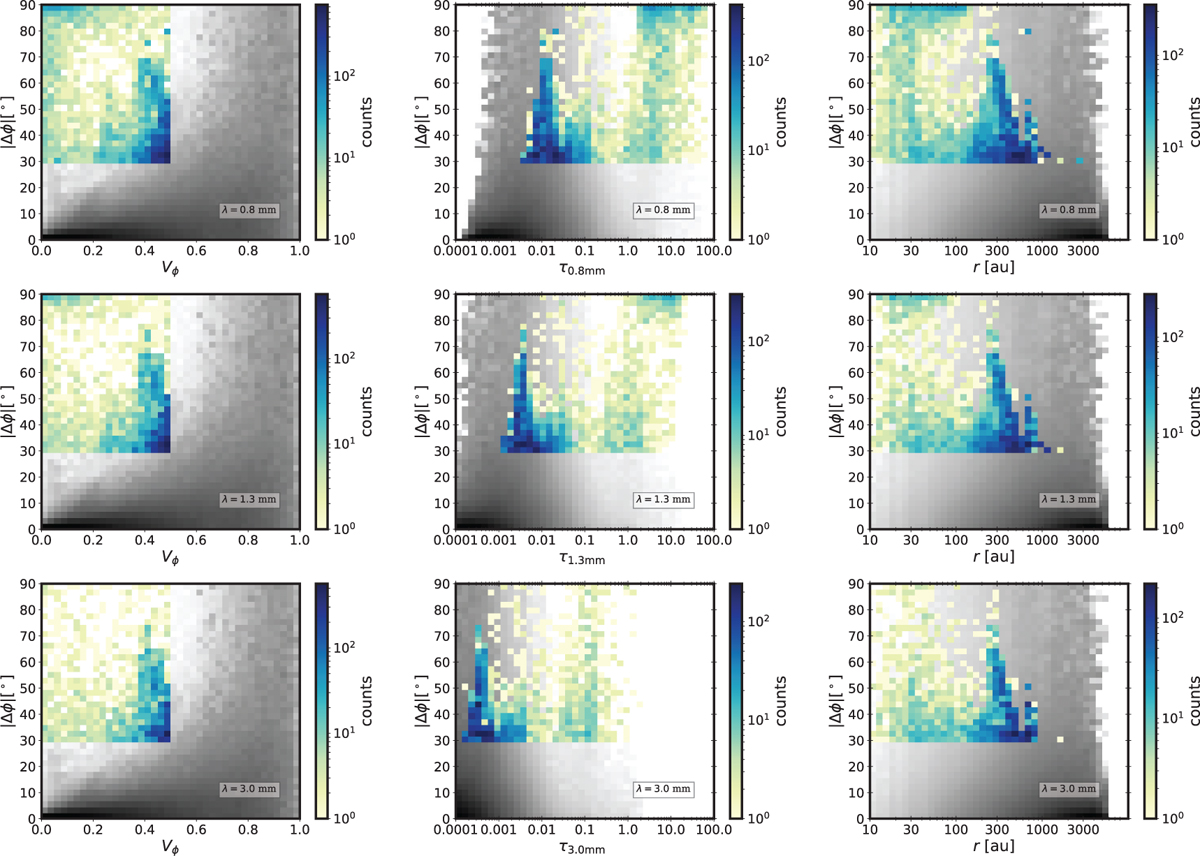
Two-dimensional histograms for the RAT case of the stacked maps (all simulations, time-steps, and projections) showing the ∆ϕ as a function of Vϕ, vs. optical depth and vs. the radial distance r ( from left to right), at three wavelengths λ = 0.8, 1.3, 3.0 mm (top to bottom).
Current usage metrics show cumulative count of Article Views (full-text article views including HTML views, PDF and ePub downloads, according to the available data) and Abstracts Views on Vision4Press platform.
Data correspond to usage on the plateform after 2015. The current usage metrics is available 48-96 hours after online publication and is updated daily on week days.
Initial download of the metrics may take a while.