Fig. 2
Download original image
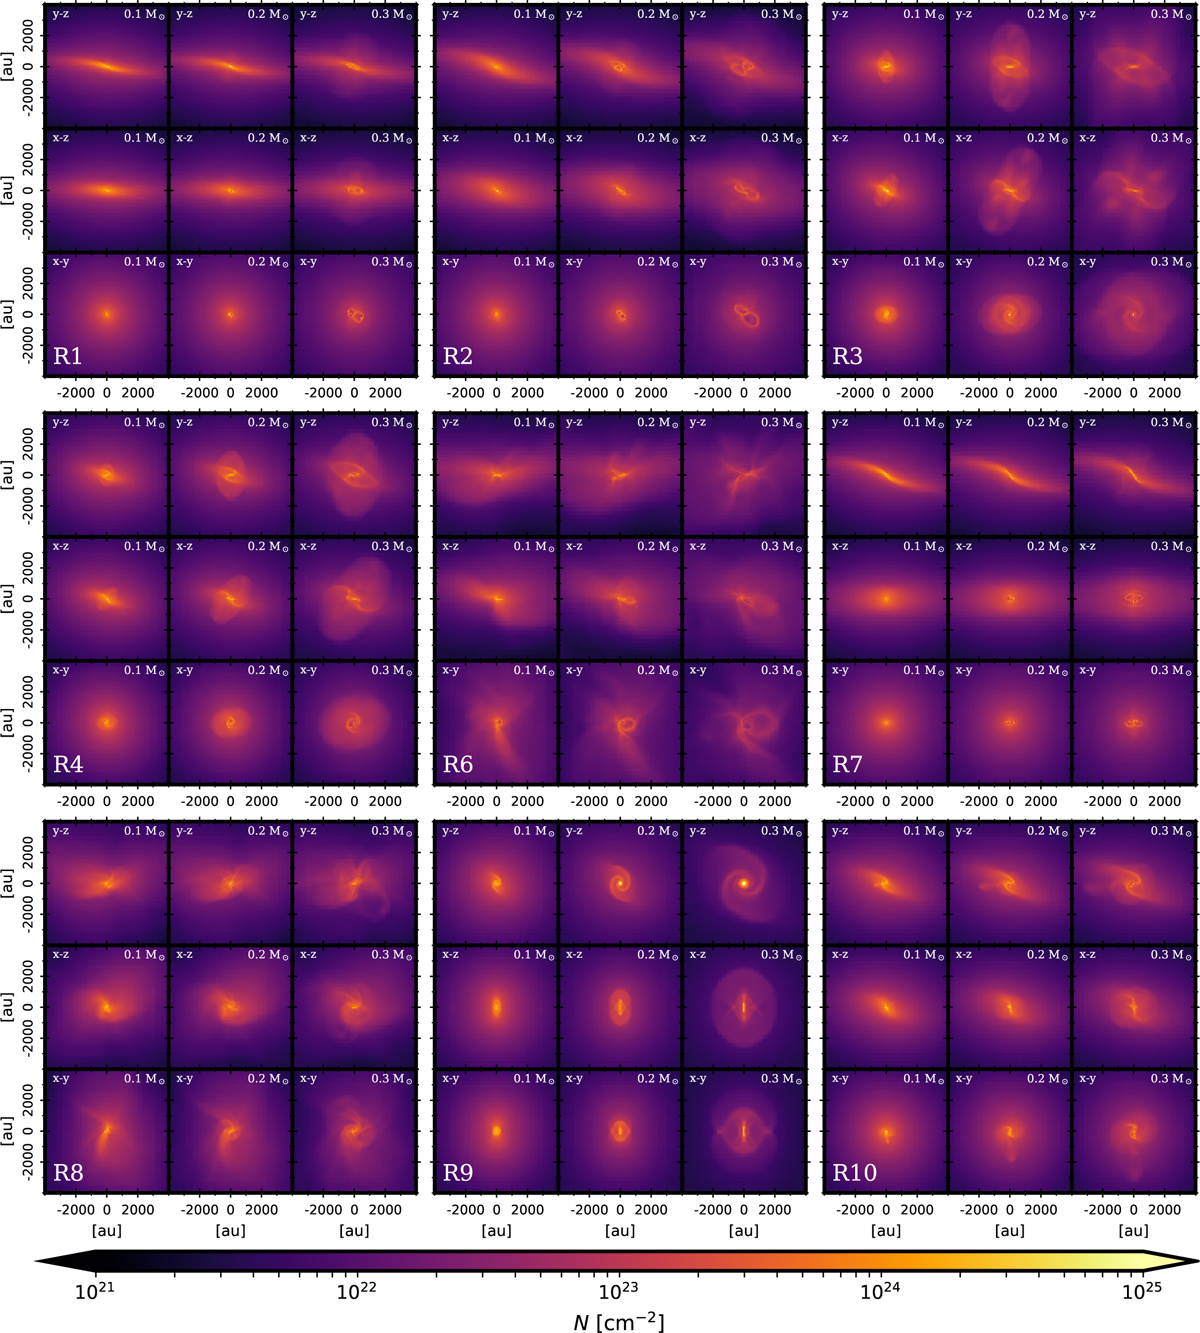
Column density maps of all the selected outputs described in Table 1. Each block corresponds to a given simulation (the identifier is indicated in the lower left corner of the block). Each block displays column density maps integrated along the x, y, and z axes (from top to bottom: y-z, x-z, and x-y maps, respectively), and for a snapshot at msink = 0.1, 0.2, and 0.3 M⊙ (from left to right). The projection and evolutionary step are shown at the top of each individual plot. Higher resolution figures for individual simulations are available online.
Current usage metrics show cumulative count of Article Views (full-text article views including HTML views, PDF and ePub downloads, according to the available data) and Abstracts Views on Vision4Press platform.
Data correspond to usage on the plateform after 2015. The current usage metrics is available 48-96 hours after online publication and is updated daily on week days.
Initial download of the metrics may take a while.