Fig. 11
Download original image
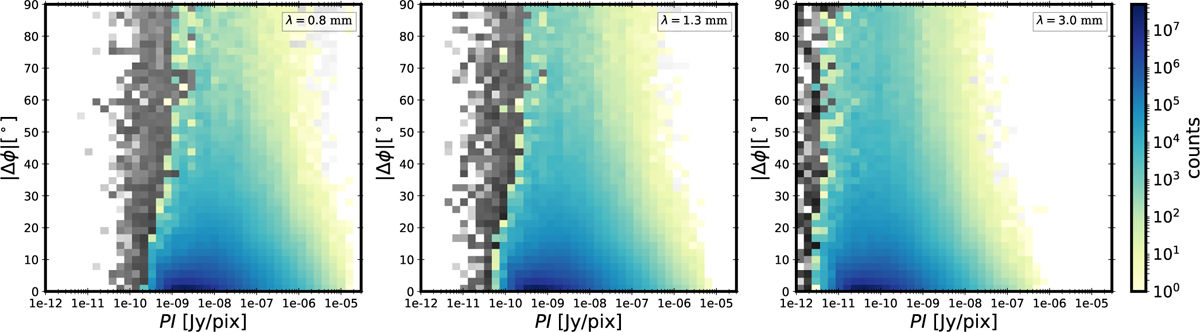
Two-dimensional histograms of the discrepancy between the mean B-field orientation and the orientation inferred from the polarized dust emission, and the intensity of the polarized dust emission at three wavelengths. From left to right λ = 0.8, 1.3, and 3.0 mm. Each histogram has been constructed using the data stacked for all simulations, time-steps, and projections. The color histograms show the results using only the lines of sight that have a polarization fraction above 1%, while the gray-scale part corresponds to the rest of the points.
Current usage metrics show cumulative count of Article Views (full-text article views including HTML views, PDF and ePub downloads, according to the available data) and Abstracts Views on Vision4Press platform.
Data correspond to usage on the plateform after 2015. The current usage metrics is available 48-96 hours after online publication and is updated daily on week days.
Initial download of the metrics may take a while.