Fig. 3
Download original image
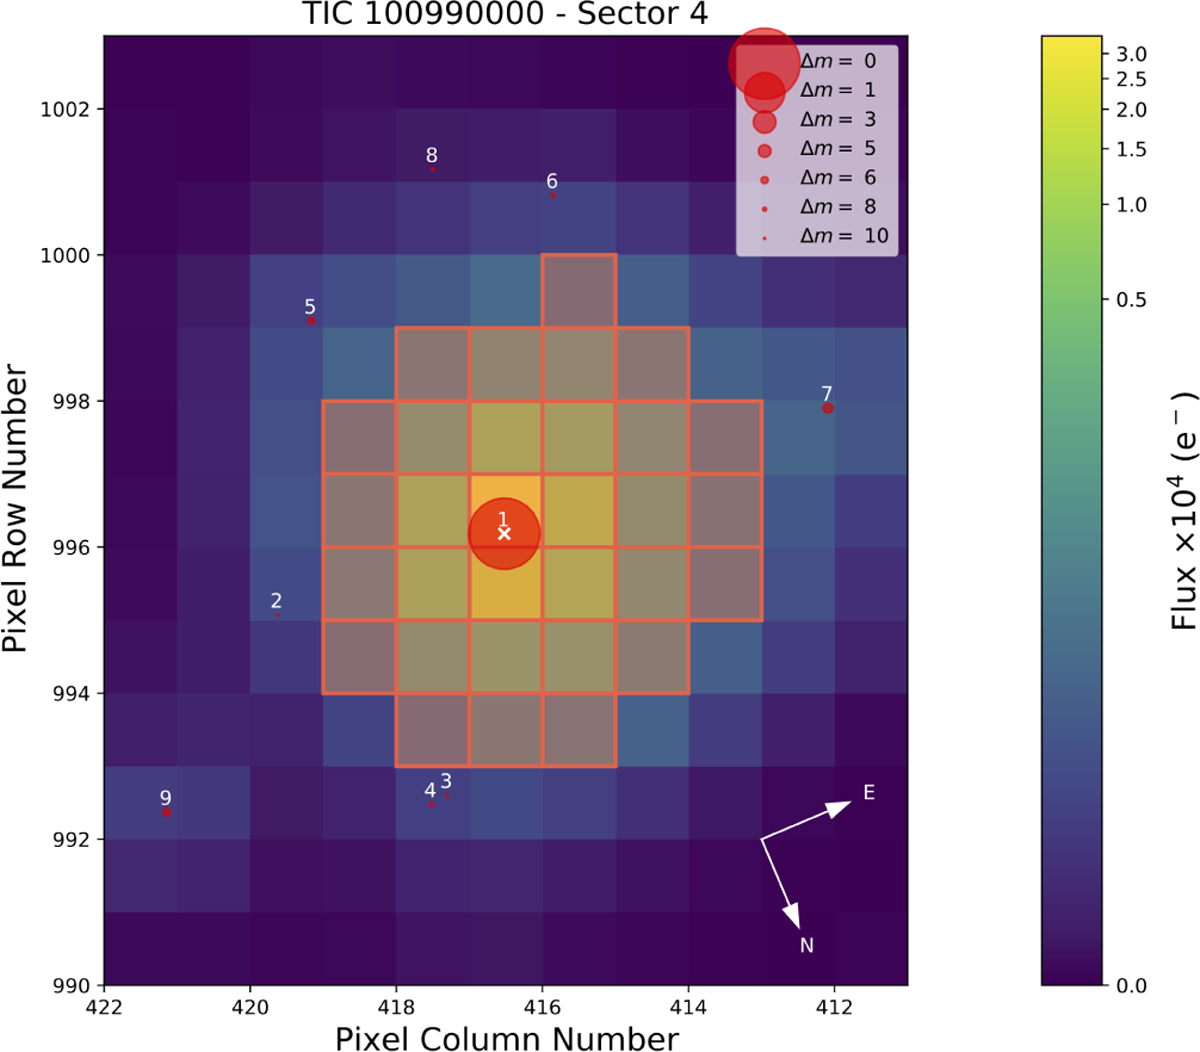
TESS image of HD 22946 taken during Sector 4 observations. The target is in the center, labeled with a “1” an white cross. Nearby sources down to +10 mag are shown as smaller red dots and labeled in order of distance from the target. The SPOC-based optimal aperture for the specific sector is overplotted in red. The color scheme represents the flux scale on the pixels. This image has been created using the tpfplotter Python package (Aller et al. 2020).
Current usage metrics show cumulative count of Article Views (full-text article views including HTML views, PDF and ePub downloads, according to the available data) and Abstracts Views on Vision4Press platform.
Data correspond to usage on the plateform after 2015. The current usage metrics is available 48-96 hours after online publication and is updated daily on week days.
Initial download of the metrics may take a while.