Fig. 7
Download original image
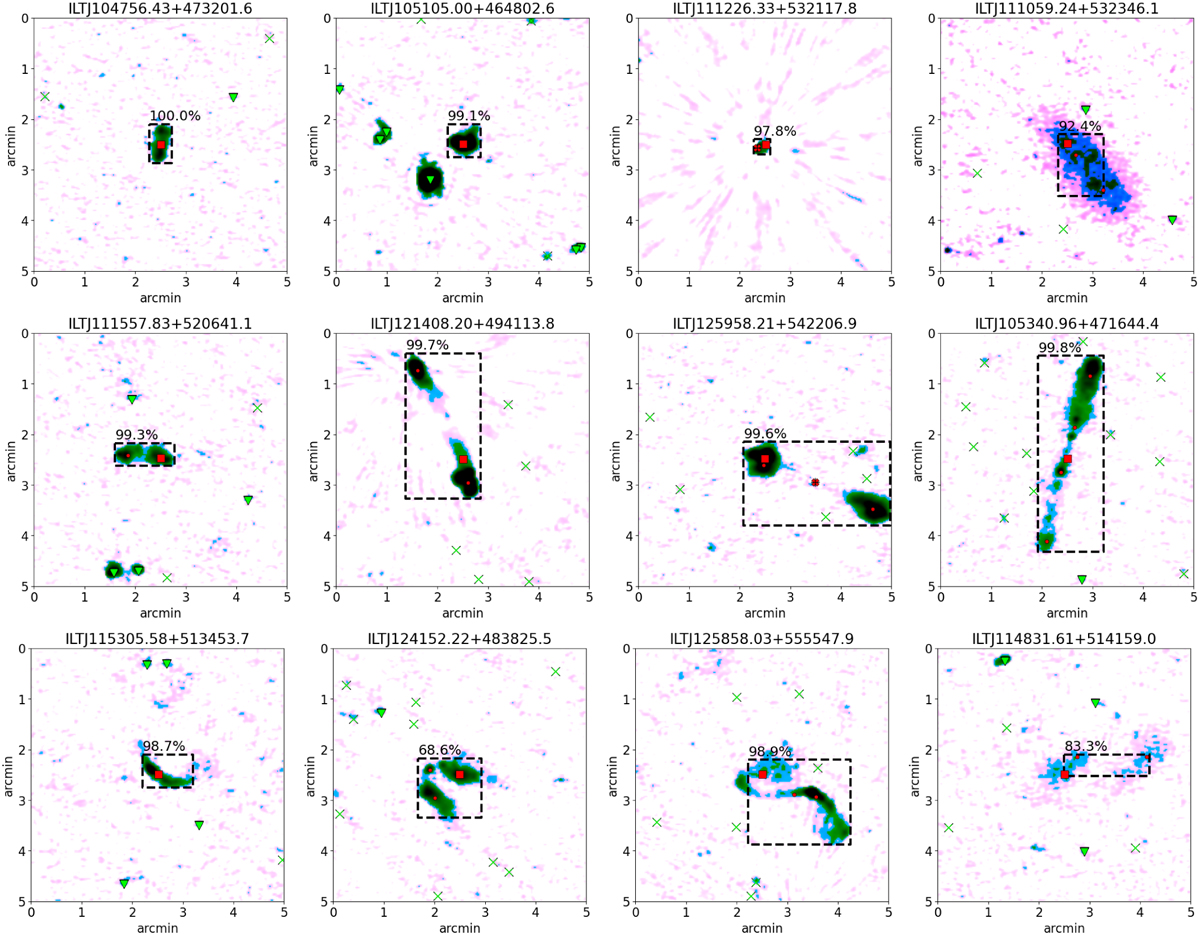
Examples of predictions (black dashed rectangles) for images from the validation set that match the manually created catalogue. These examples are curated to show the model predictions for a wide range of source morphologies. Each image is a 300 × 300 arcsec cutout of LoTSS-DR2 Stokes-I, pre-processed as detailed in Sect. 4.3. The red square indicates the position of the focussed PyBDSF radio component, and the red dots indicate the position of PyBDSF radio components that are related to the focussed component according to the corrected LOFAR Galaxy Zoo catalogue. The green triangles indicate the position of components that are unrelated to the focussed component. ‘x’s (thick marker if related, thin if unrelated) indicate components that we removed, and a black cross on top of an ‘x’ means the component was automatically reinserted after the prediction. In our method, all components that fall inside the predicted black rectangular box (and are not removed) are combined into a single radio source.
Current usage metrics show cumulative count of Article Views (full-text article views including HTML views, PDF and ePub downloads, according to the available data) and Abstracts Views on Vision4Press platform.
Data correspond to usage on the plateform after 2015. The current usage metrics is available 48-96 hours after online publication and is updated daily on week days.
Initial download of the metrics may take a while.