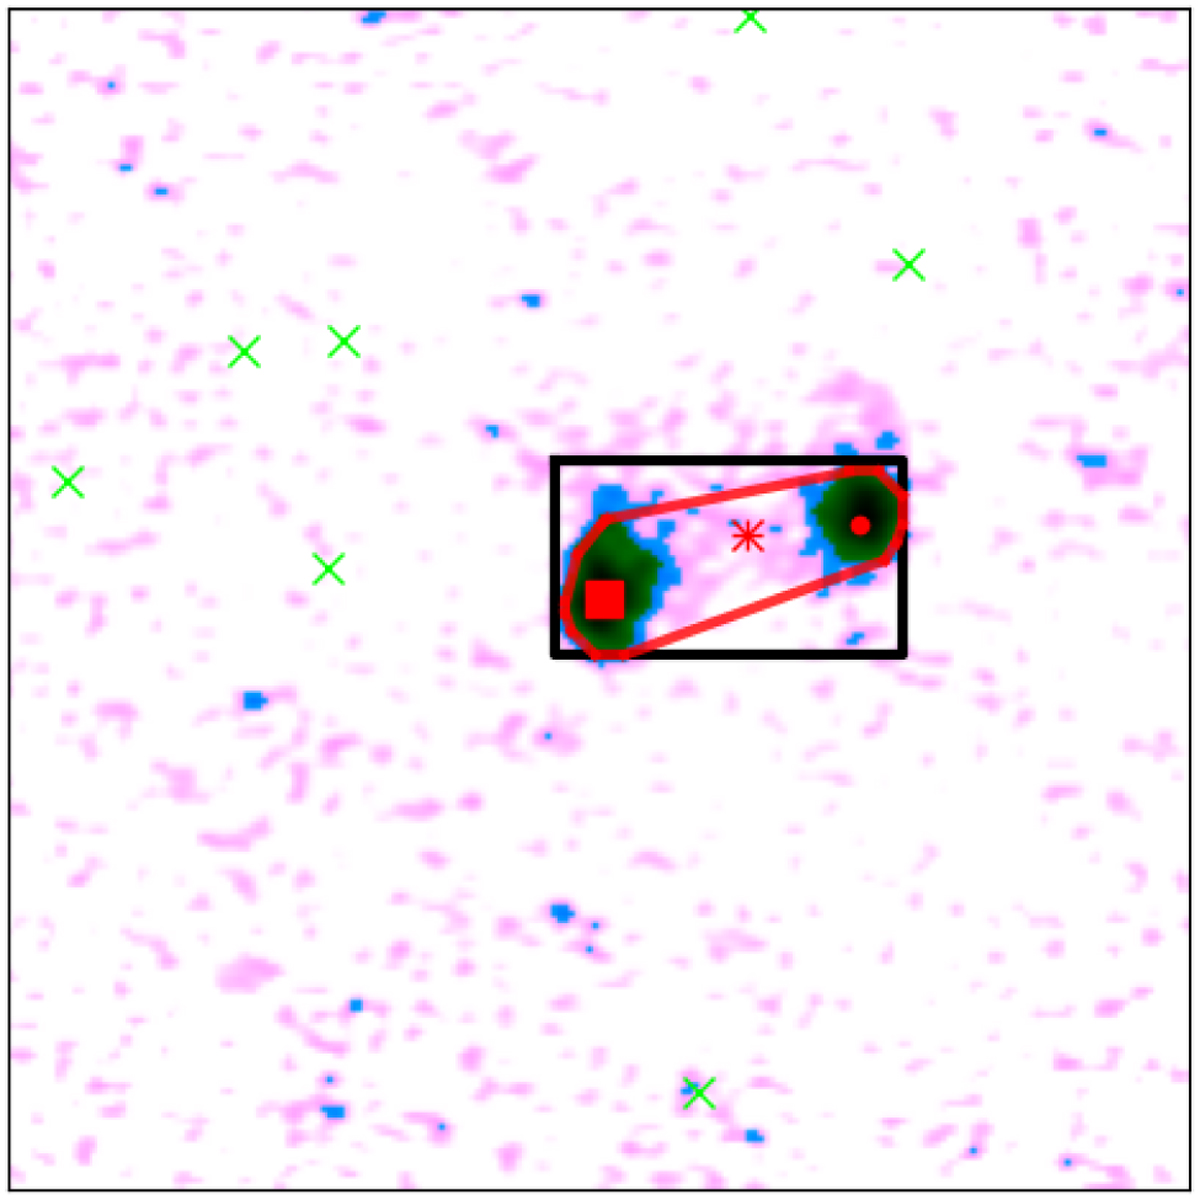
Fig. 5
Download original image
Demonstrating reinsertion of a removed unresolved source. The background shows a LoTSS-DR2 intensity image, the black rectangle indicates our ground truth region encompassing the focussed radio component (red square) and its related components (red). The green markers indicate the locations of unrelated radio components. Components removed by the GBC are shown as ‘x’s. Sources that fall within the convex hull (solid red line) around the five-sigma emission of the radio components within the predicted region will be reinserted (a ‘+’ on top of an ‘x’).
Current usage metrics show cumulative count of Article Views (full-text article views including HTML views, PDF and ePub downloads, according to the available data) and Abstracts Views on Vision4Press platform.
Data correspond to usage on the plateform after 2015. The current usage metrics is available 48-96 hours after online publication and is updated daily on week days.
Initial download of the metrics may take a while.