Fig. 4
Download original image
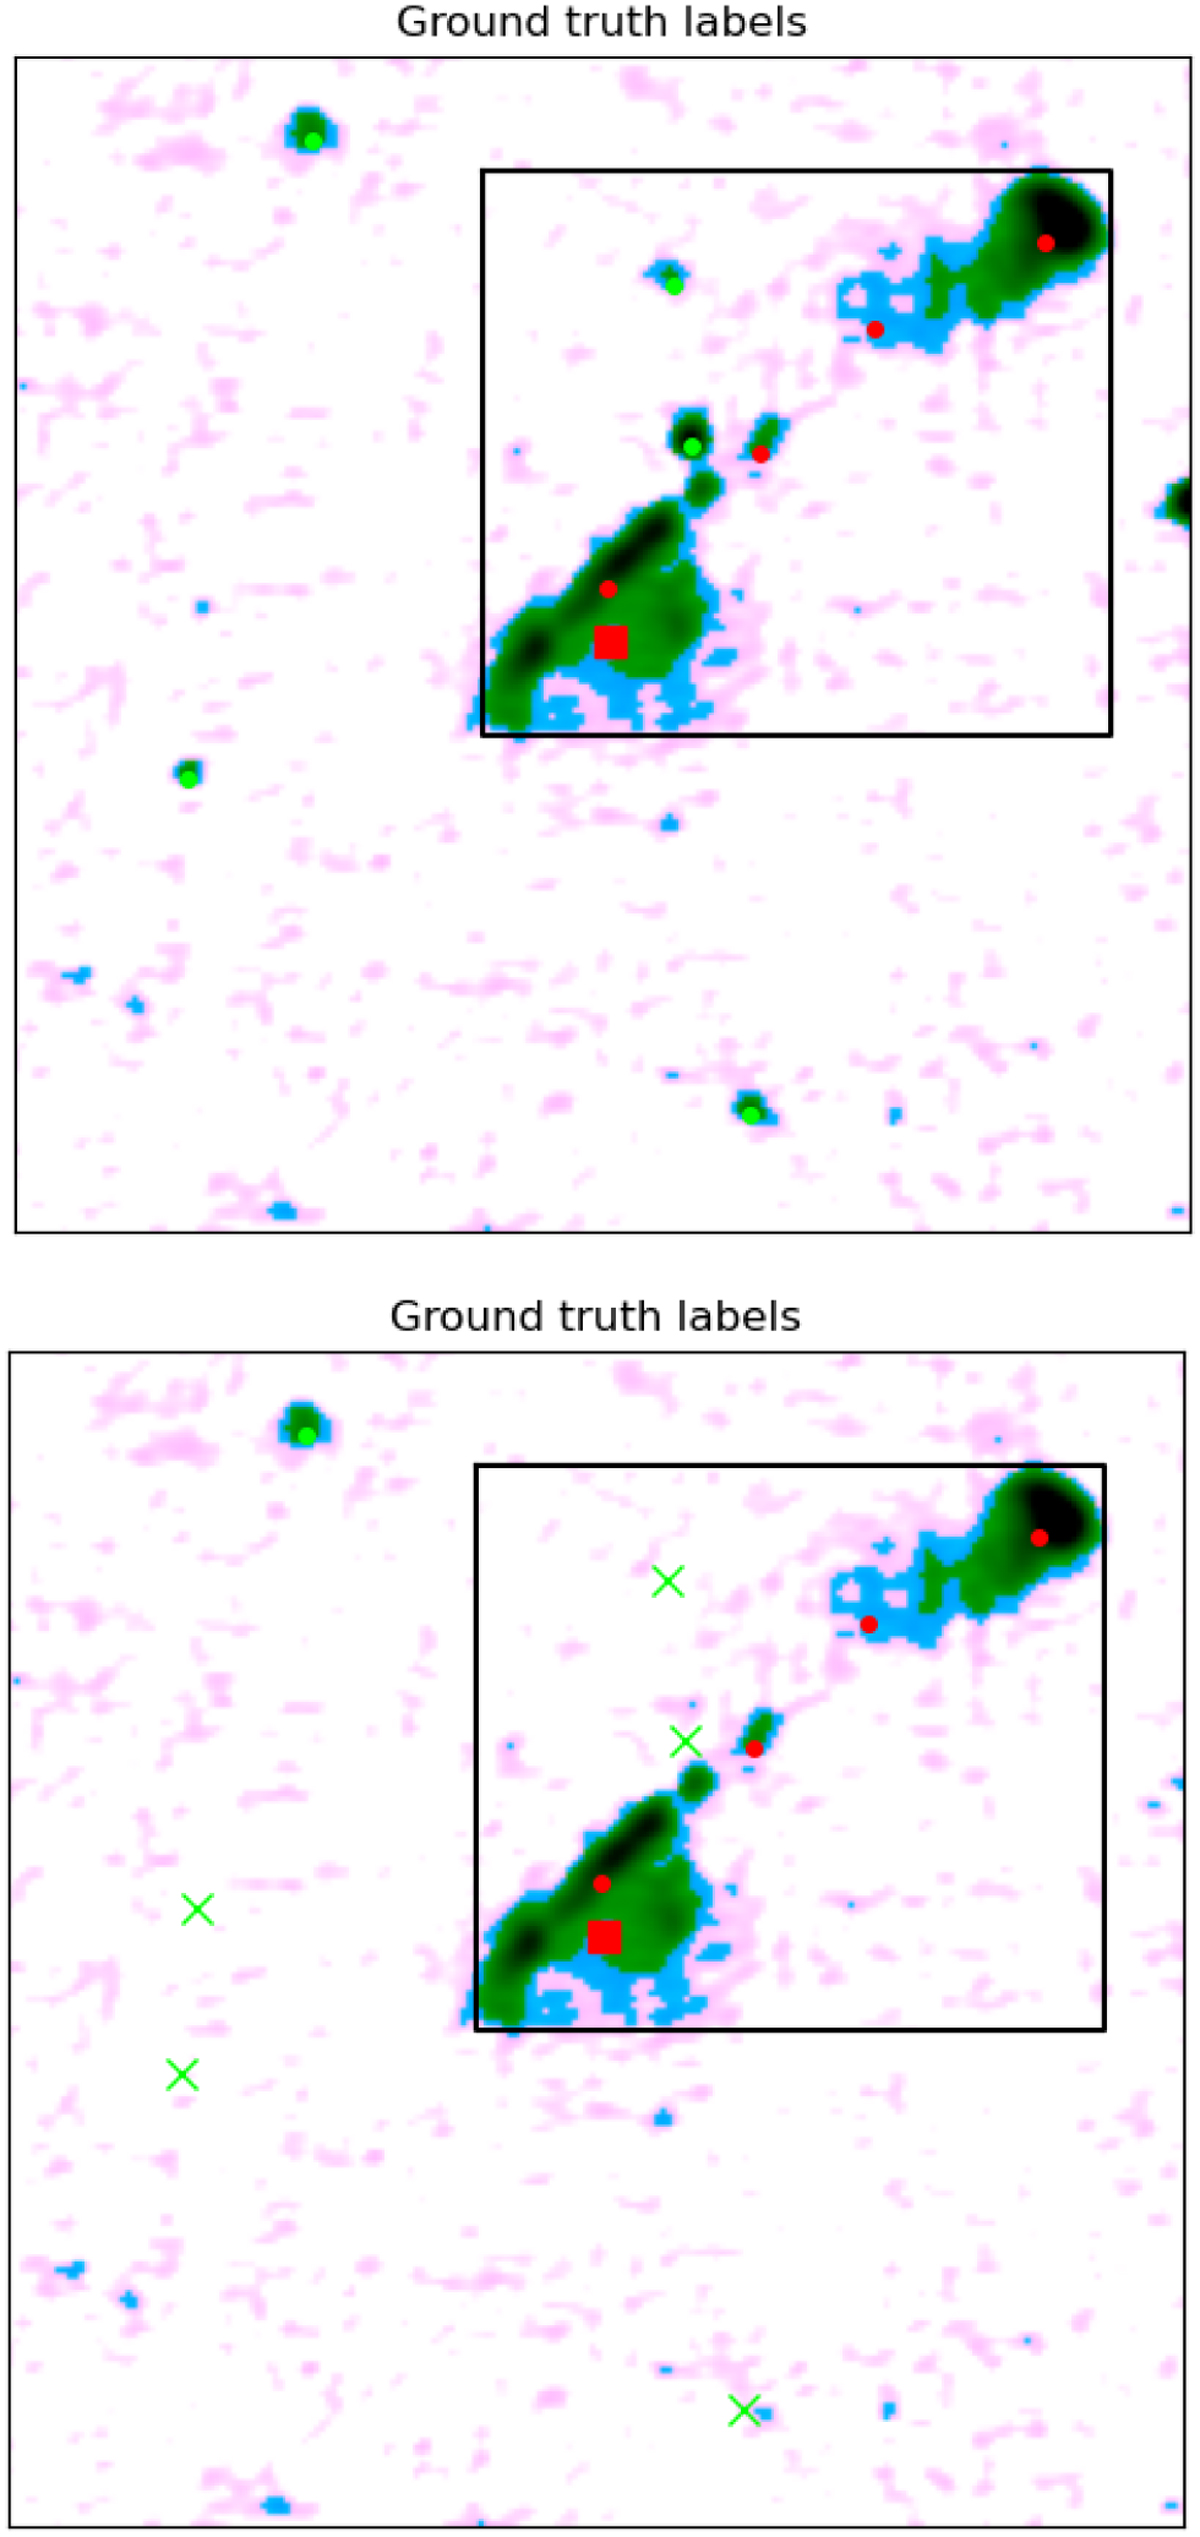
Two figures demonstrating the simplification achieved by removing sources that are likely to not require manual association. The background shows LoTSS-DR2 intensity images, the black rectangle indicates our ground truth region encompassing the focussed radio component (red square) and its related components (red dots). The green dots indicate the locations of unrelated radio components. In the second figure, components removed by the GBC are shown as ‘x’s.
Current usage metrics show cumulative count of Article Views (full-text article views including HTML views, PDF and ePub downloads, according to the available data) and Abstracts Views on Vision4Press platform.
Data correspond to usage on the plateform after 2015. The current usage metrics is available 48-96 hours after online publication and is updated daily on week days.
Initial download of the metrics may take a while.