Fig. 3
Download original image
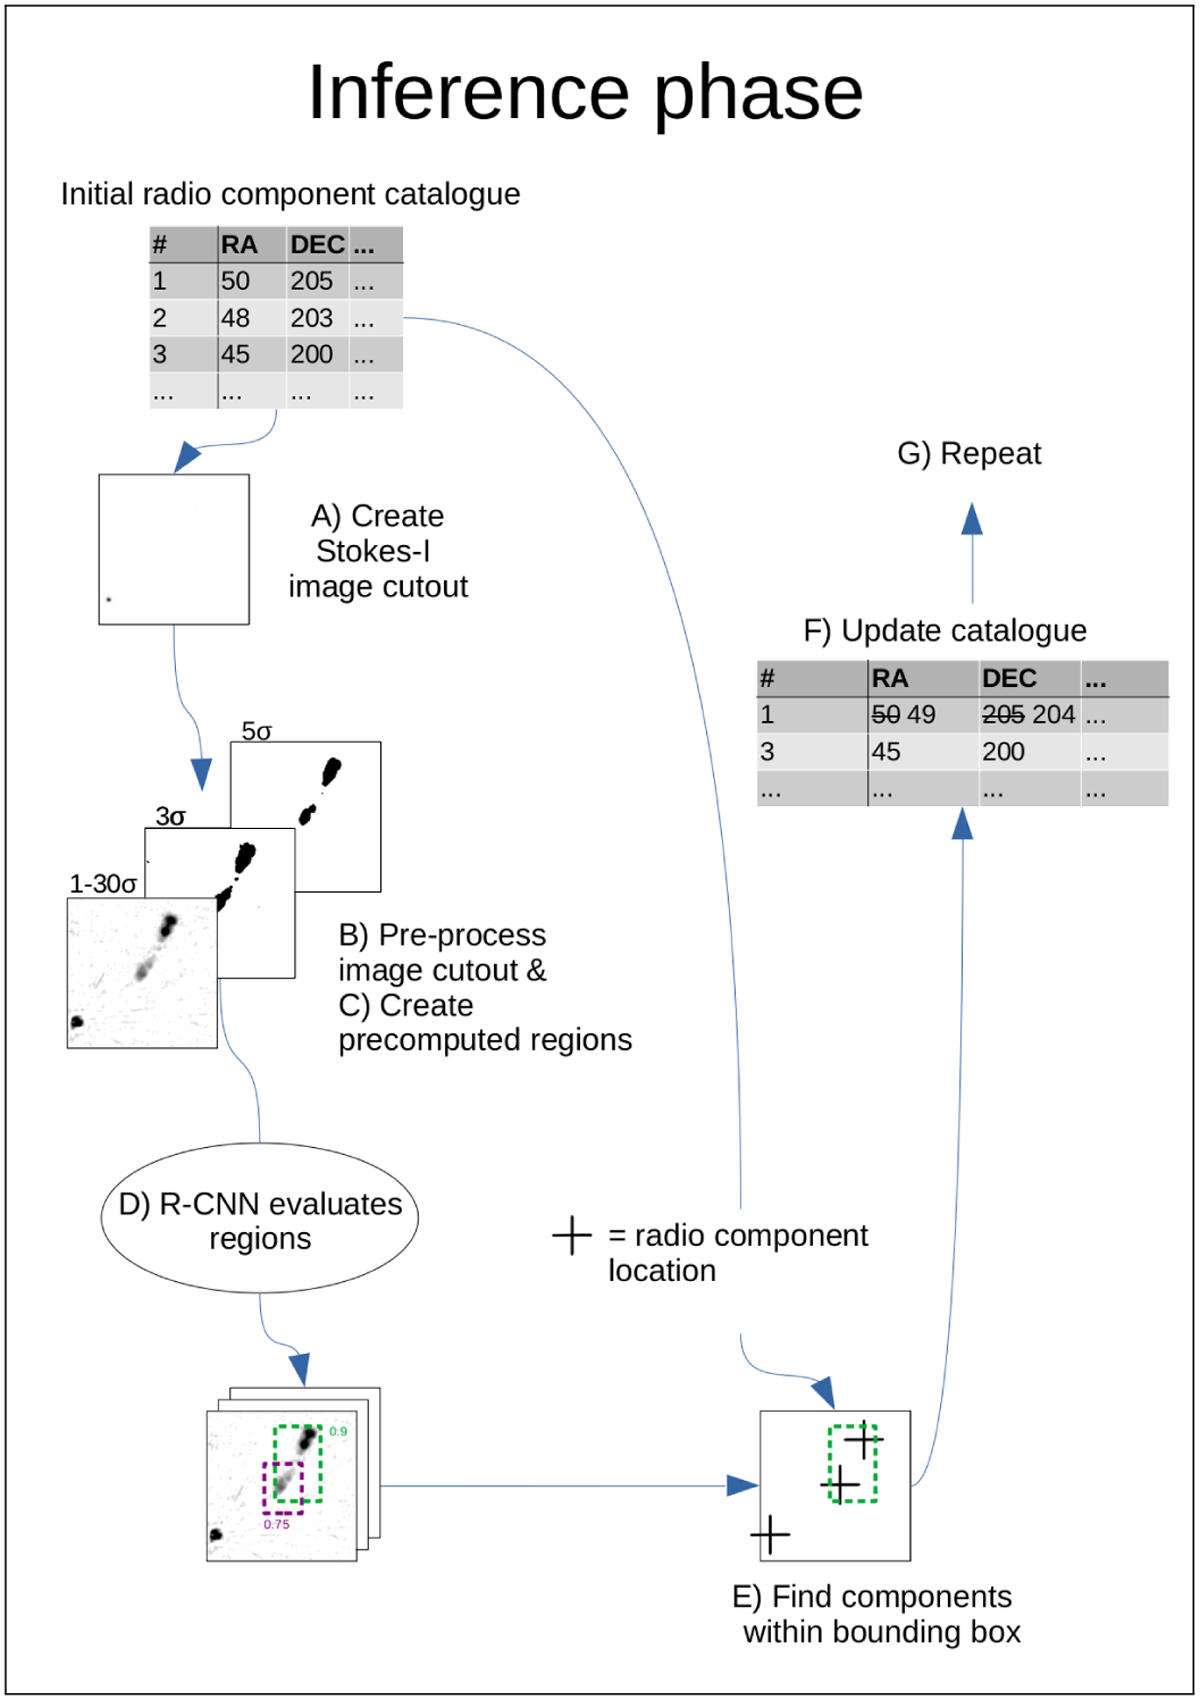
Diagram of inference phase. We start from a radio component catalogue created by PyBDSF. (A) We create an image cutout centred on a radio component from the initial catalogue. (B) We pre-process the image for the R-CNN. (C) We pre-compute regions (see Sect. 4.4). (D) The R-CNN predicts several regions and corresponding prediction scores based on the image (known as a ‘forward pass’). (E) We select the region that covers the central radio component and has the highest prediction score. We then look for the radio component coordinates that lie within this region. (F) These radio components will enter the updated radio source catalogue combined into a single entry. (G) Steps A–E are repeated for all radio components in our inference dataset.
Current usage metrics show cumulative count of Article Views (full-text article views including HTML views, PDF and ePub downloads, according to the available data) and Abstracts Views on Vision4Press platform.
Data correspond to usage on the plateform after 2015. The current usage metrics is available 48-96 hours after online publication and is updated daily on week days.
Initial download of the metrics may take a while.