Fig. 2
Download original image
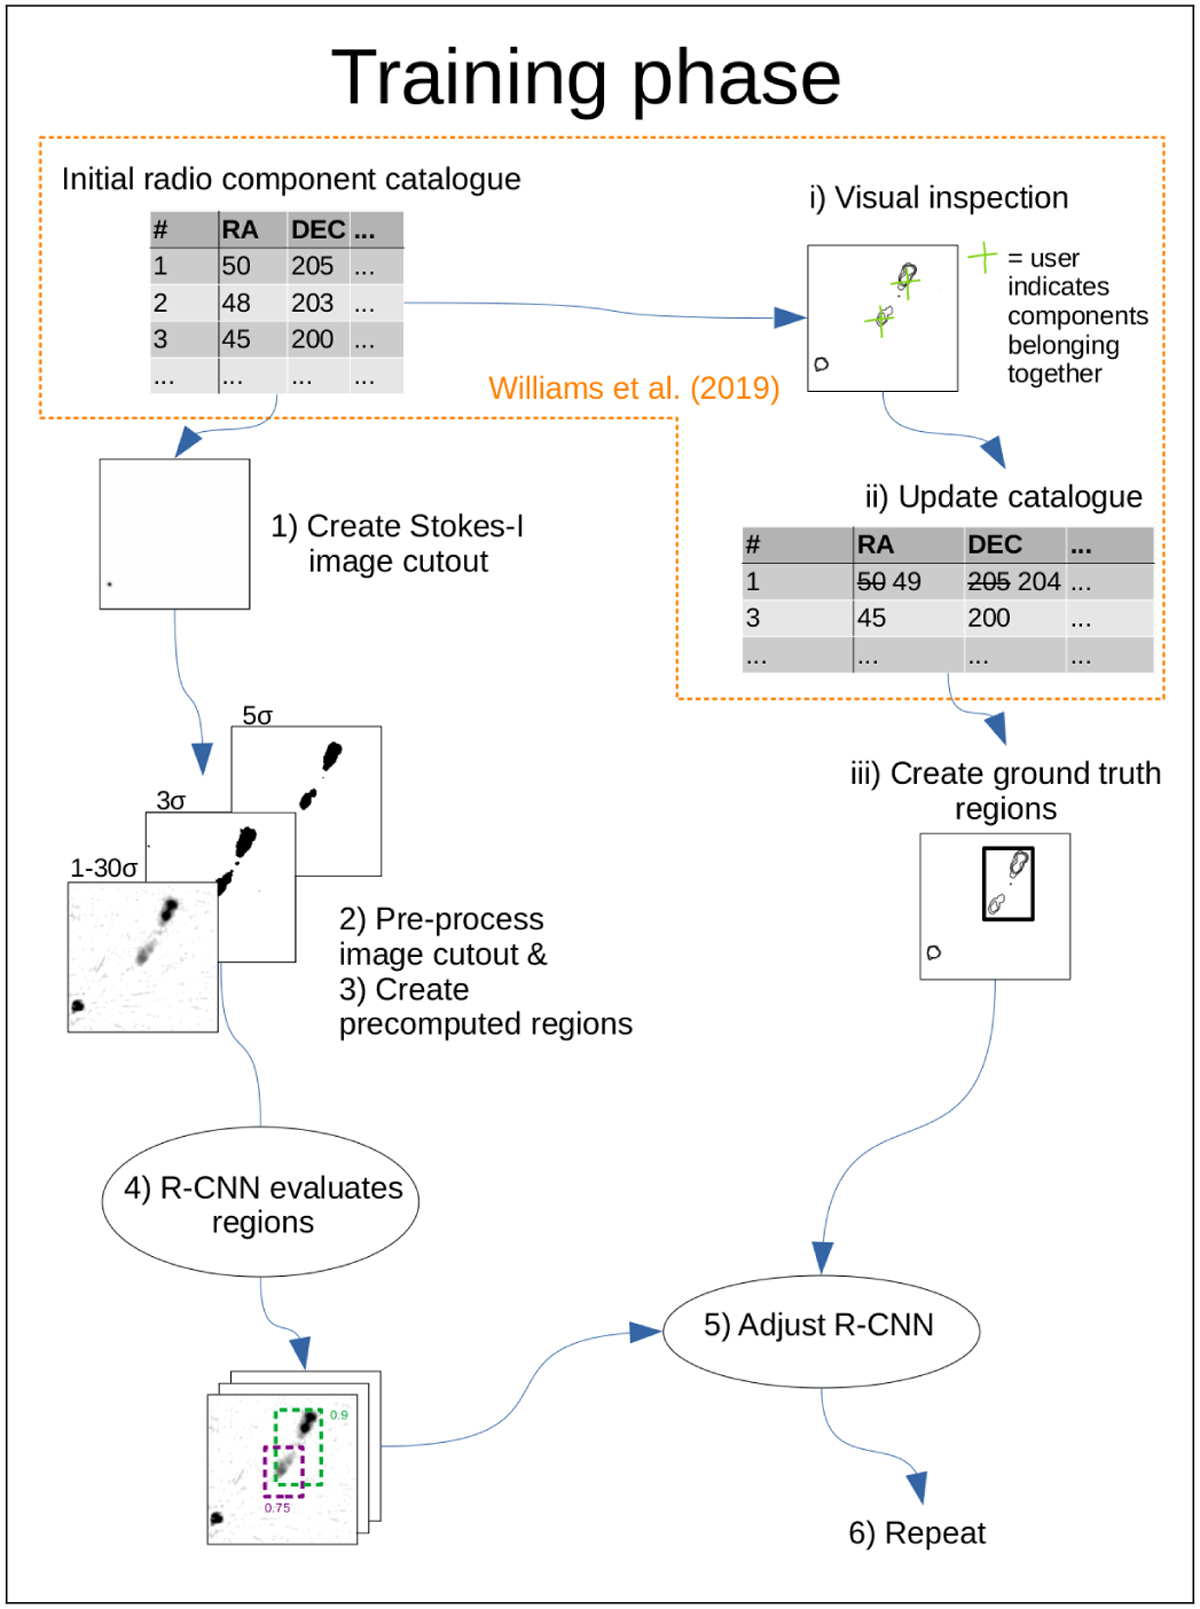
Diagram of training phase. We start from a radio component catalogue created by PyBDSF. (i) Users indicate which radio components belong together via crowd-sourced visual inspection. (ii) This information is used to create an improved source catalogue (see Sect. 3). (iii) This improved source catalogue and the component catalogue are used to draw ground truth regions. (1) We create an image cutout centred on a radio component from the initial catalogue (if it is included in our training set). (2) We pre-process the image for the R-CNN. (3) We pre-compute regions (see Sect. 4.4). (4) The R-CNN evaluates the regions and predicts corresponding class scores based on the image (known as a ‘forward pass’). (5) We update the network parameters using stochastic gradient descent such that subsequent predicted regions have greater overlap with the ground truth region (known as ‘backpropagation’). (6) Steps 1–4 are repeated for all radio components in our training dataset.
Current usage metrics show cumulative count of Article Views (full-text article views including HTML views, PDF and ePub downloads, according to the available data) and Abstracts Views on Vision4Press platform.
Data correspond to usage on the plateform after 2015. The current usage metrics is available 48-96 hours after online publication and is updated daily on week days.
Initial download of the metrics may take a while.