Open Access
Fig. C.1
Download original image
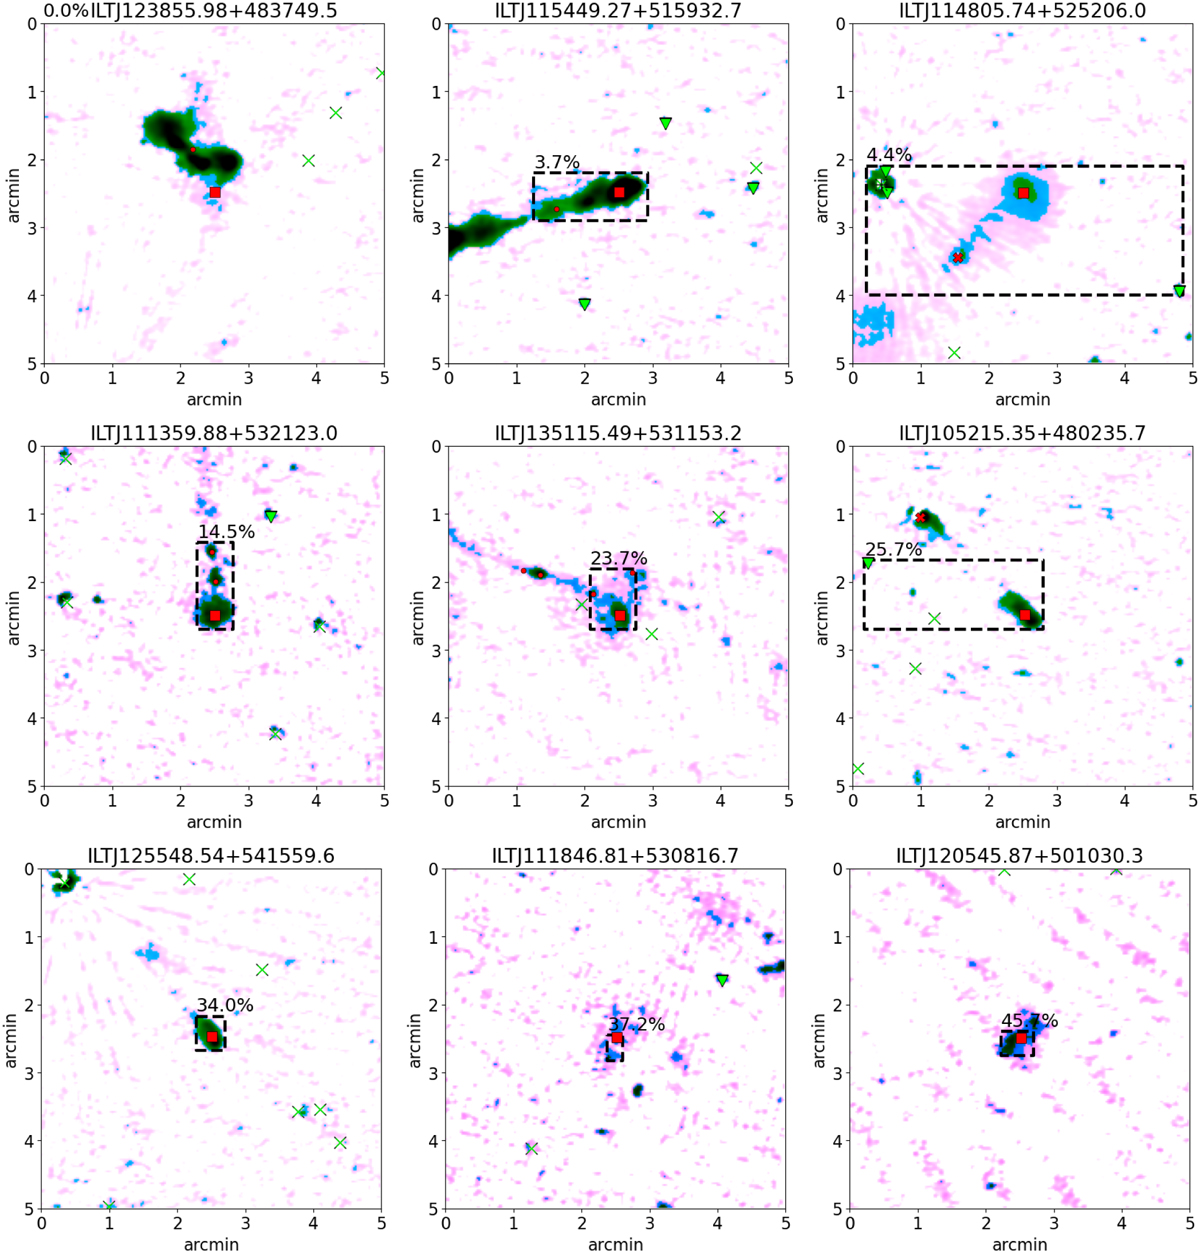
Characteristic examples of regions (dashed black rectangles) with a predicted score below 50%, sorted by ascending prediction score (see Fig. 7 for an explanation of the markers used).
Current usage metrics show cumulative count of Article Views (full-text article views including HTML views, PDF and ePub downloads, according to the available data) and Abstracts Views on Vision4Press platform.
Data correspond to usage on the plateform after 2015. The current usage metrics is available 48-96 hours after online publication and is updated daily on week days.
Initial download of the metrics may take a while.