Fig. A.1
Download original image
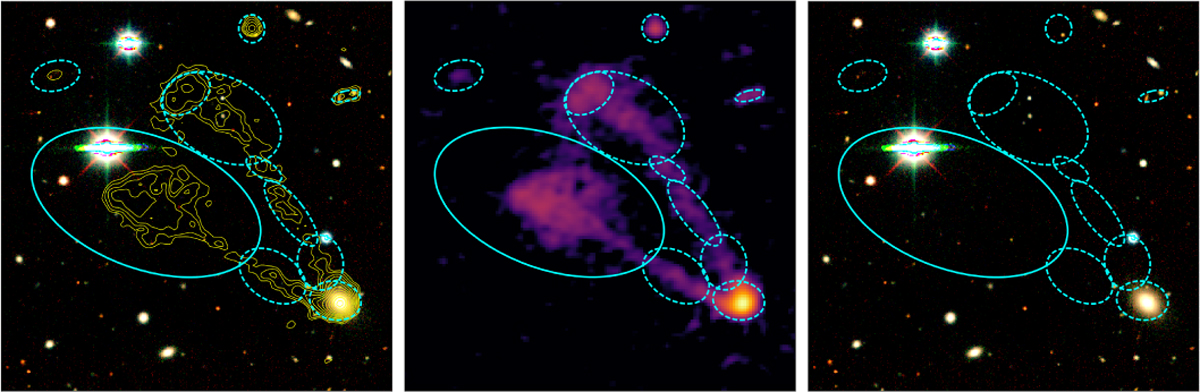
Three figures or panels available to the user in the manual association process of LoTSS-DR2 in the public Zooniverse project. The first and third figures show the LEGACY (optical) R-band intensity image and the second figure shows LoTSS-DR2 stokes I intensity. LoTSS-DR2 radio stokes I (yellow) contours are overlaid on the first figure. The light blue ellipses show the FWHM of the PyBDSF-fitted Gaussians to each LoTSS-DR2 radio component. The light blue ellipse with solid line indicates which component the user should focus on. The users are asked to click on the centre of each dashed ellipse that they believe should be associated with the emission behind the full ellipse. The figures are taken from the ongoing public LOFAR Galaxy Zoo project at lofargalaxyzoo.nl.
Current usage metrics show cumulative count of Article Views (full-text article views including HTML views, PDF and ePub downloads, according to the available data) and Abstracts Views on Vision4Press platform.
Data correspond to usage on the plateform after 2015. The current usage metrics is available 48-96 hours after online publication and is updated daily on week days.
Initial download of the metrics may take a while.