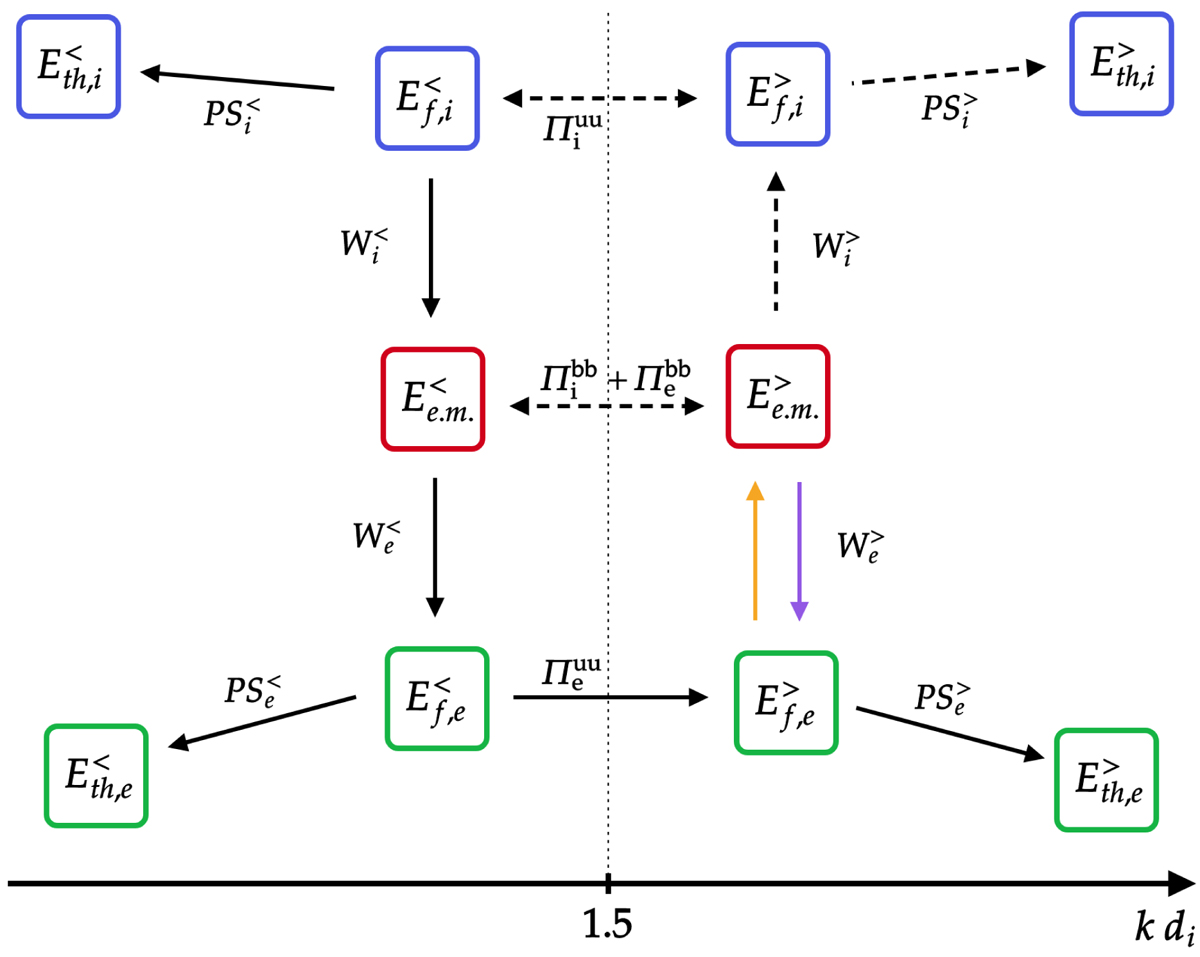
Fig. 6.

Download original image
Diagram of the global energy balance between large and sub-ion scales in our simulation. The superscripts < and > indicate quantities at scales k di < 1.5 and k di ≥ 1.5 respectively. The arrows indicate the direction in which the energy is transferred by the corresponding channels (the double arrows indicate no preferred direction). Solid arrows indicate strong channels while weak channels are represented by dashed arrows. The two colors used for ![]() indicate
indicate ![]() (orange) and
(orange) and ![]() (purple).
(purple).
Current usage metrics show cumulative count of Article Views (full-text article views including HTML views, PDF and ePub downloads, according to the available data) and Abstracts Views on Vision4Press platform.
Data correspond to usage on the plateform after 2015. The current usage metrics is available 48-96 hours after online publication and is updated daily on week days.
Initial download of the metrics may take a while.


