Fig. 6.
Download original image
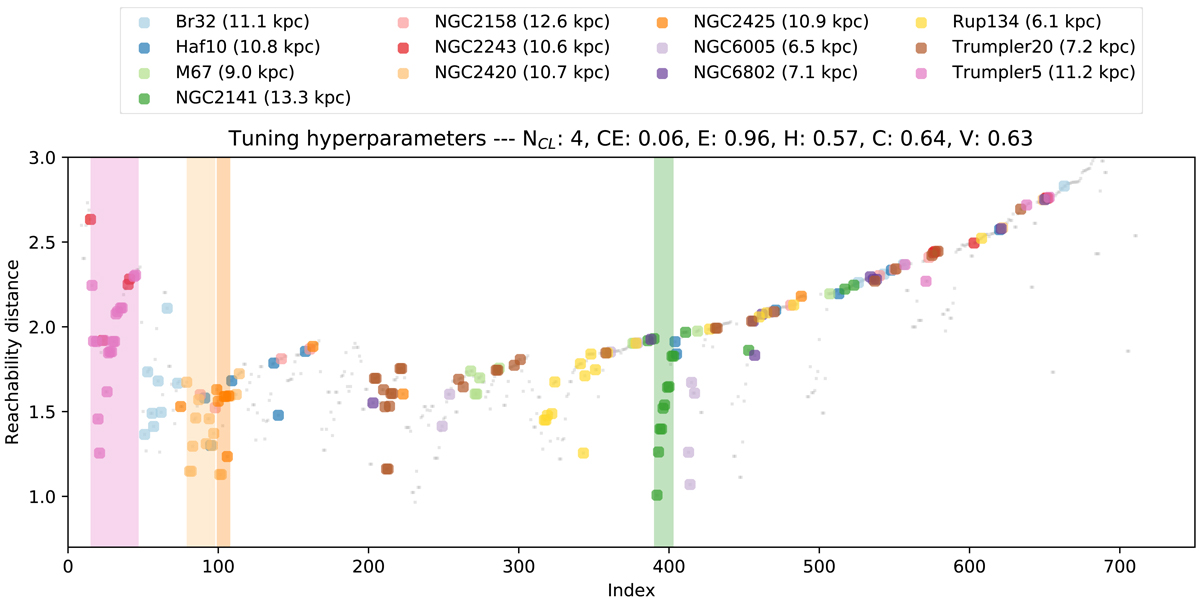
The figure shows the reachability-plot resulting from the clustering analysis of the data set comprising the 190 stars of the optimizing sample, 112 stars of the hidden cluster sample, and the 465 stars of the field stars sample. The open cluster members of the optimizing sample are shown with coloured points. All the other stars are represented as gray points. The solution represented here corresponds to the one that maximises the number of recovered clusters from the optimizing sample (Ncl). The overdensities found by OPTICS corresponding to the recovered open clusters are highlighted with vertical coloured bands.
Current usage metrics show cumulative count of Article Views (full-text article views including HTML views, PDF and ePub downloads, according to the available data) and Abstracts Views on Vision4Press platform.
Data correspond to usage on the plateform after 2015. The current usage metrics is available 48-96 hours after online publication and is updated daily on week days.
Initial download of the metrics may take a while.