Fig. 2.
Download original image
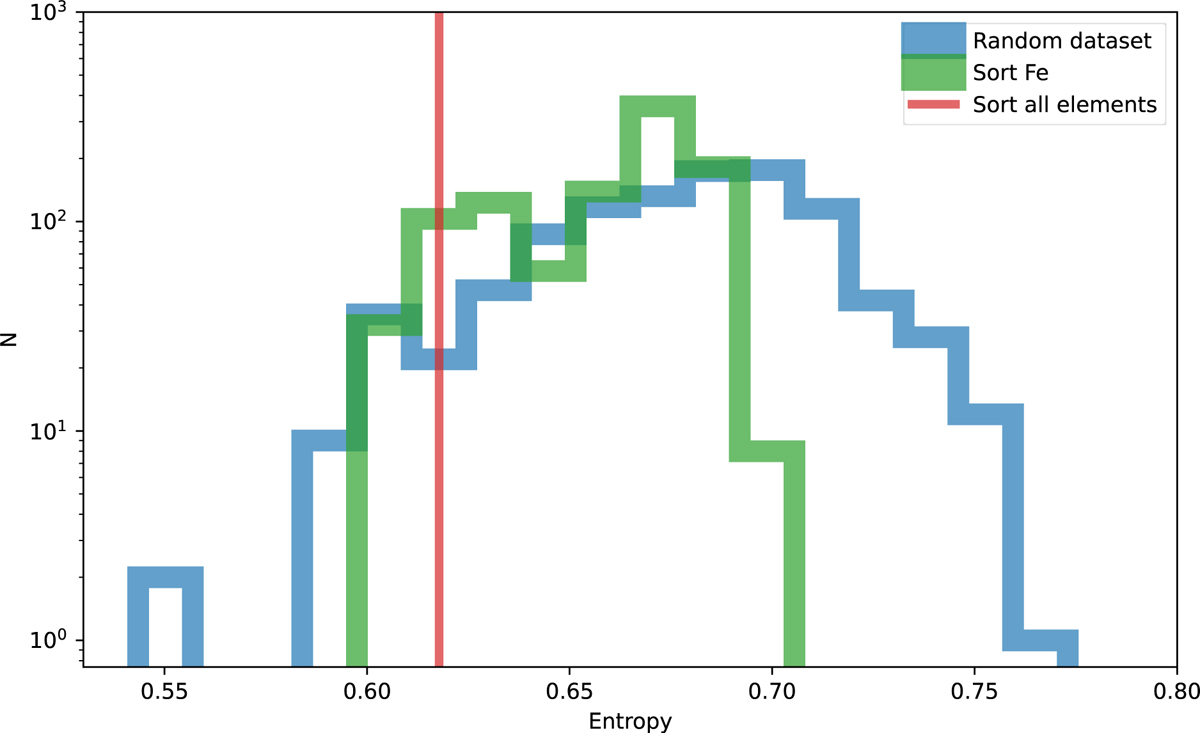
The entropy values resulting from the 1000 trials of clustering analysis carried out by OPTICS on a data set that is randomly ordered (blue histogram), and on a data set that was sorted as a function of [Fe/H] (green histogram). Finally the red vertical line shows the entropy that is obtained when the data set is sorted as a function of the [X/H] abundances, starting with [Fe/H] followed by all the other elements.
Current usage metrics show cumulative count of Article Views (full-text article views including HTML views, PDF and ePub downloads, according to the available data) and Abstracts Views on Vision4Press platform.
Data correspond to usage on the plateform after 2015. The current usage metrics is available 48-96 hours after online publication and is updated daily on week days.
Initial download of the metrics may take a while.