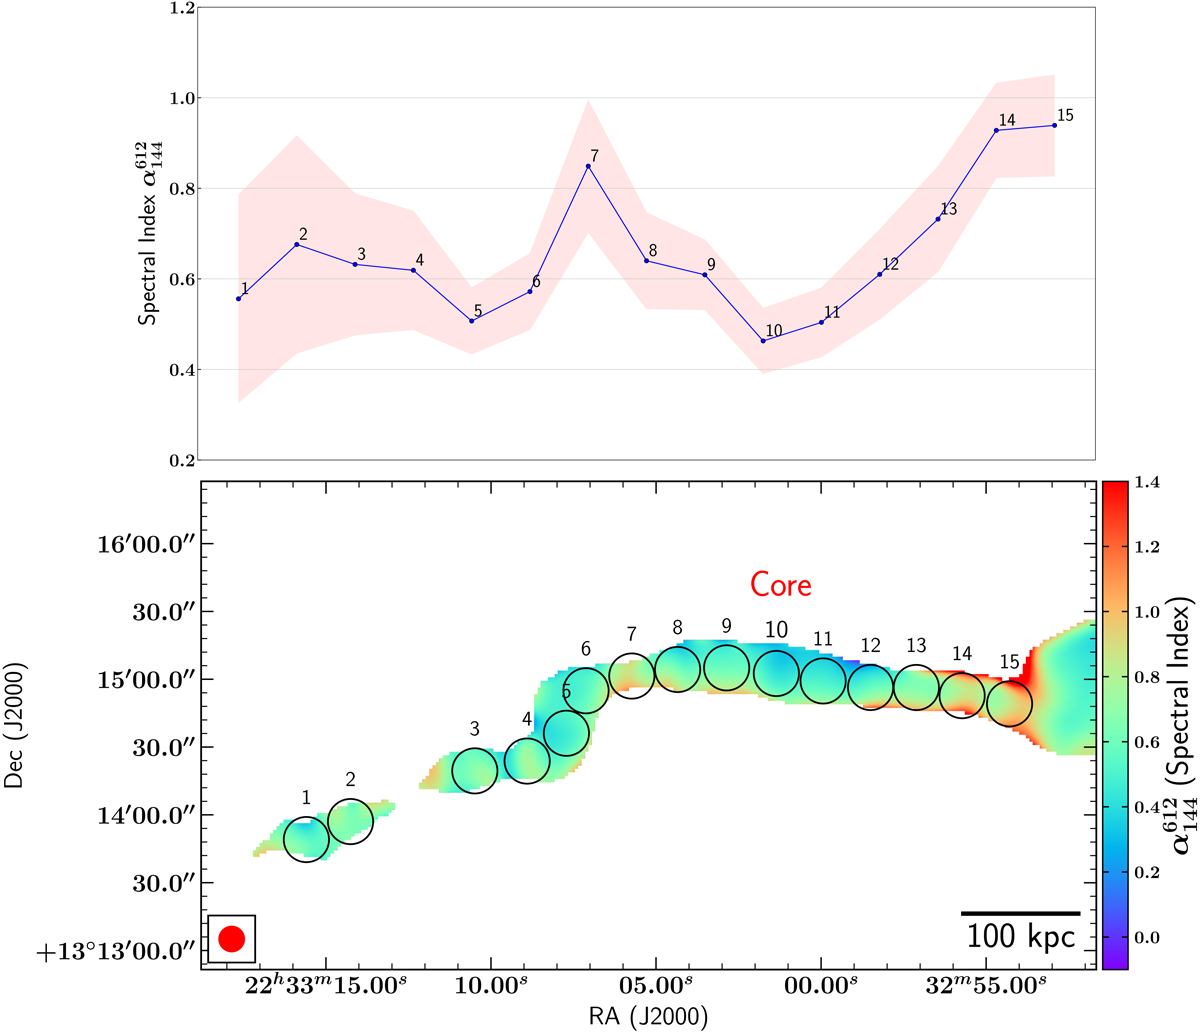
Fig. 5.
Download original image
The figure shows spectral index variation in the jets of the source. Upper panel: jet spectral index profile with respect to the marked regions seen in the lower plot. The shaded region indicates the uncertainties on the measurements. Lower panel: zoomed-in portion of Fig. 4 highlighting the core and jet. The numbered regions are labelled.
Current usage metrics show cumulative count of Article Views (full-text article views including HTML views, PDF and ePub downloads, according to the available data) and Abstracts Views on Vision4Press platform.
Data correspond to usage on the plateform after 2015. The current usage metrics is available 48-96 hours after online publication and is updated daily on week days.
Initial download of the metrics may take a while.