Fig. 4.
Download original image
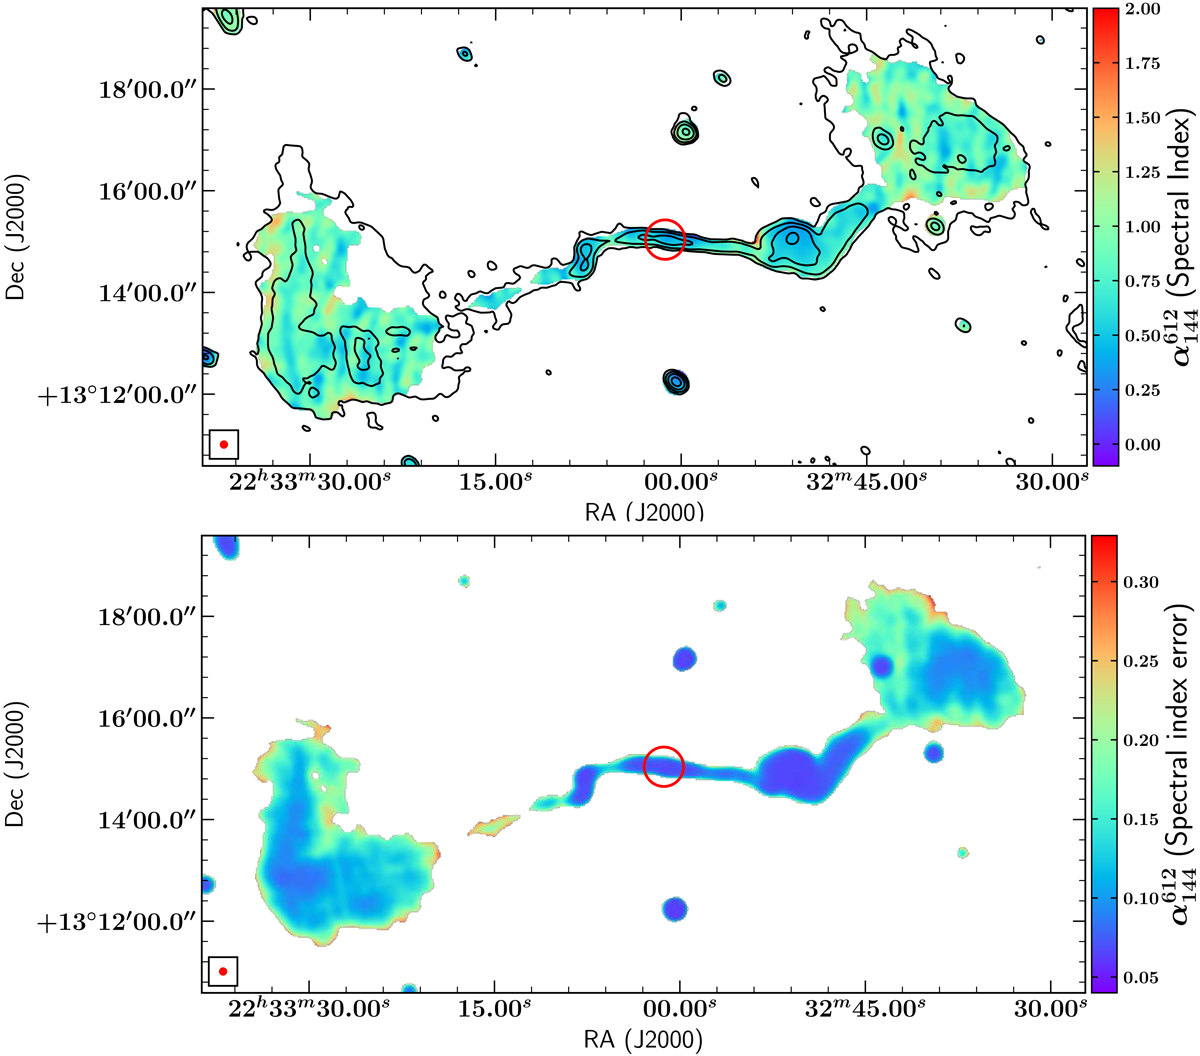
Figure shows three frequency spectral index map and its uncertainties. Upper panel: spectral index map made using LOFAR 144 MHz, GMRT 323 MHz, and GMRT 612 MHz maps (described in Sect. 3.5). The GMRT 323 MHz contours are overplotted in black with six levels spaced in log scale with the lowest level of 3σ (Table 3). The red circle indicates the location of the radio core or host galaxy. In the bottom left corner, the red dot represents the beam of 13″ × 13″. Lower panel: spectral index error map.
Current usage metrics show cumulative count of Article Views (full-text article views including HTML views, PDF and ePub downloads, according to the available data) and Abstracts Views on Vision4Press platform.
Data correspond to usage on the plateform after 2015. The current usage metrics is available 48-96 hours after online publication and is updated daily on week days.
Initial download of the metrics may take a while.