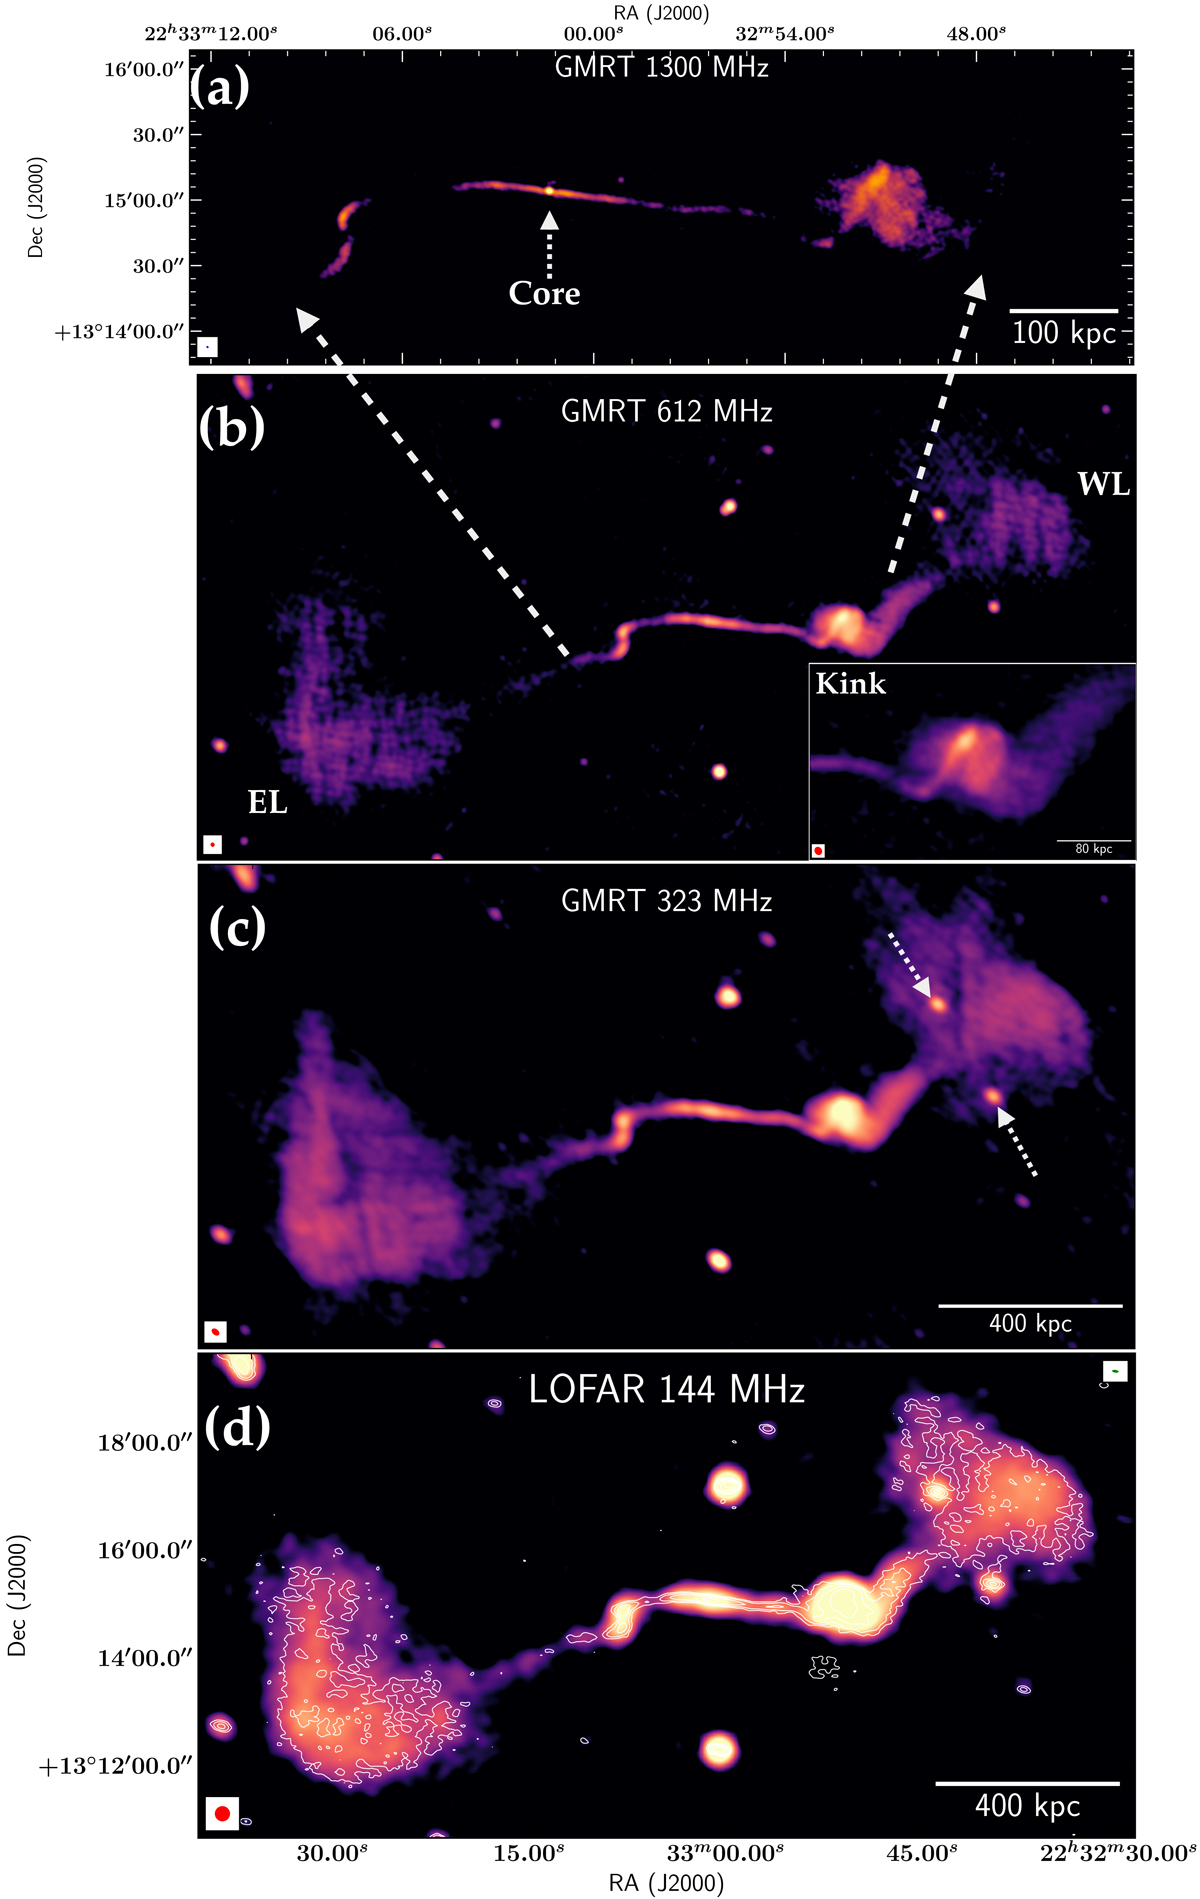
Fig. 2.
Download original image
Radio images of GRG-J2233+1315 at 1300 (a), 612 (b), 323 (c), and 144 MHz (d). The RMS and resolution information of the images are provided in Table 3. The white box at the bottom left represents the beam. In panel b an additional zoomed-in image of the kink feature of the GRG is shown (see inset at bottom right). The two arrows in panel c show two unrelated sources. In panel d the LOFAR 144 MHz image is shown with two resolutions. The higher resolution is represented by contours, whose beam is shown in the top right corner of the panel. The radio contours in panel d are drawn with six levels, which are chosen by equally (in log scale) dividing the data value range above 3σ (local rms of the map).
Current usage metrics show cumulative count of Article Views (full-text article views including HTML views, PDF and ePub downloads, according to the available data) and Abstracts Views on Vision4Press platform.
Data correspond to usage on the plateform after 2015. The current usage metrics is available 48-96 hours after online publication and is updated daily on week days.
Initial download of the metrics may take a while.