Fig. 2
Download original image
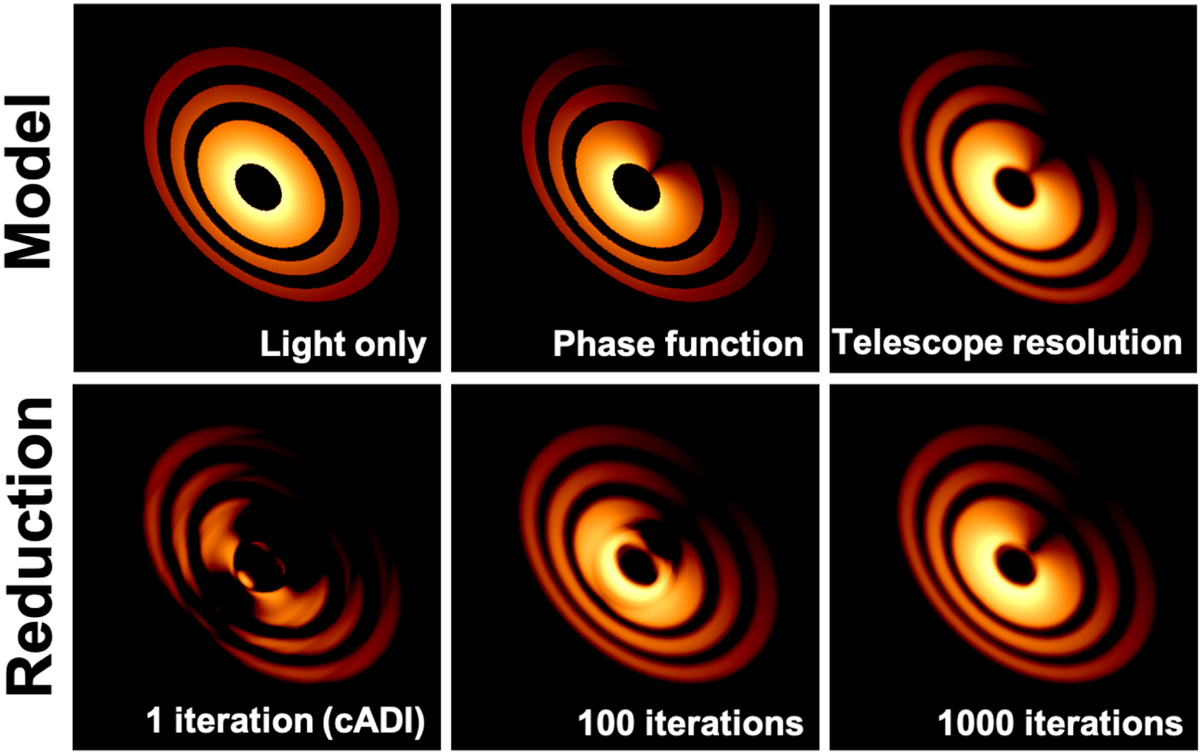
Model used in this work together with a reduction with the IADI pipeline. The top panels show, from left to right, a ~1/r2 intensity dependence from the center of the disk, the addition of the phase function, and telescope resolution. The bottom panels present the recovered disk after 1, 100, and 1000 iterations. This shows that with classical ADI, large parts of the disk are not recovered due to self-subtraction, but that these can be recovered iteratively. All images use a log-scale to make the faint parts of the disk more visible.
Current usage metrics show cumulative count of Article Views (full-text article views including HTML views, PDF and ePub downloads, according to the available data) and Abstracts Views on Vision4Press platform.
Data correspond to usage on the plateform after 2015. The current usage metrics is available 48-96 hours after online publication and is updated daily on week days.
Initial download of the metrics may take a while.