Fig. 1
Download original image
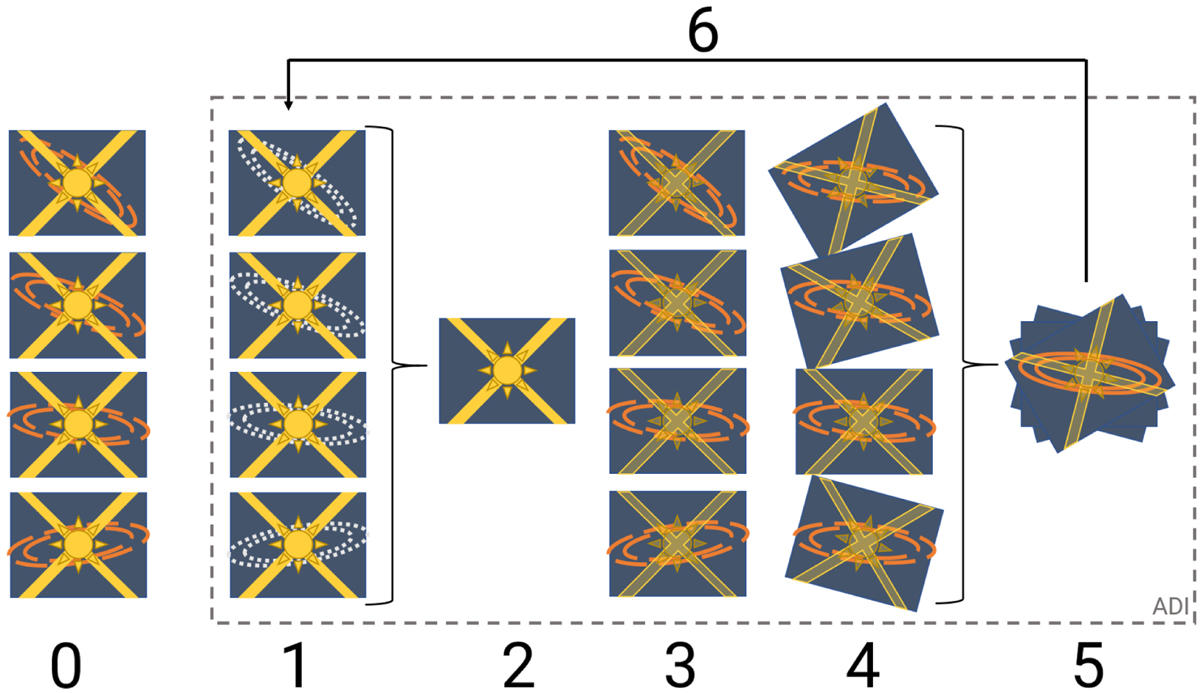
Flowchart depicting the different steps in the IADI reduction process. 0. Copy of the original data set, which is used after every iteration. 1. The original data set minus the final result from step 5. If this is the first iteration, the data sets of step 0 and 1 are identical. Even after some iterations, some disk signal is left in this data set after subtracting the final result. This is shown as the gray dotted ellipses. 2. Take the median of the data set (cIADI) or construct the PSF with principal components after taking the mean of the data set (PCA-IADI). 3. Subtract the found PSF from each image in the original data set copied in step 0. 4. Derotate the data set such that the science object has the same orientation in all images. 5. Take the median of all derotated images to combine them and get the final result. 6. Feedback all positive signal of the final result from step 5 to step 1 and then repeat the process.
Current usage metrics show cumulative count of Article Views (full-text article views including HTML views, PDF and ePub downloads, according to the available data) and Abstracts Views on Vision4Press platform.
Data correspond to usage on the plateform after 2015. The current usage metrics is available 48-96 hours after online publication and is updated daily on week days.
Initial download of the metrics may take a while.