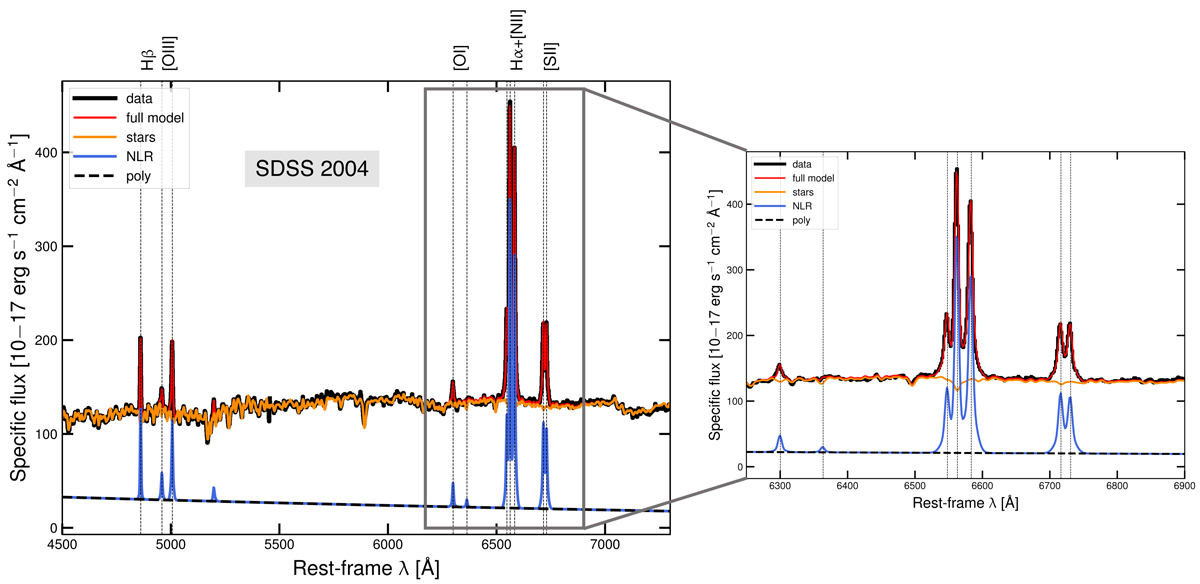
Fig. B.3.
Download original image
Best-fit modelling of the SDSS 2004 spectrum (left). Data are shown as solid black line along with the full best-fit model in red, and separate models for the various spectral components in different colours (see legend). A slight 1st-degree polynomial (dashed black line) is fitted to the weak AGN continuum, while no BLR components are detected. Zoom over the spectral window 6250 − 6900 Å around the Hα line, clearly showing the total absence of a broad Hα component (right).
Current usage metrics show cumulative count of Article Views (full-text article views including HTML views, PDF and ePub downloads, according to the available data) and Abstracts Views on Vision4Press platform.
Data correspond to usage on the plateform after 2015. The current usage metrics is available 48-96 hours after online publication and is updated daily on week days.
Initial download of the metrics may take a while.