Fig. 2.
Download original image
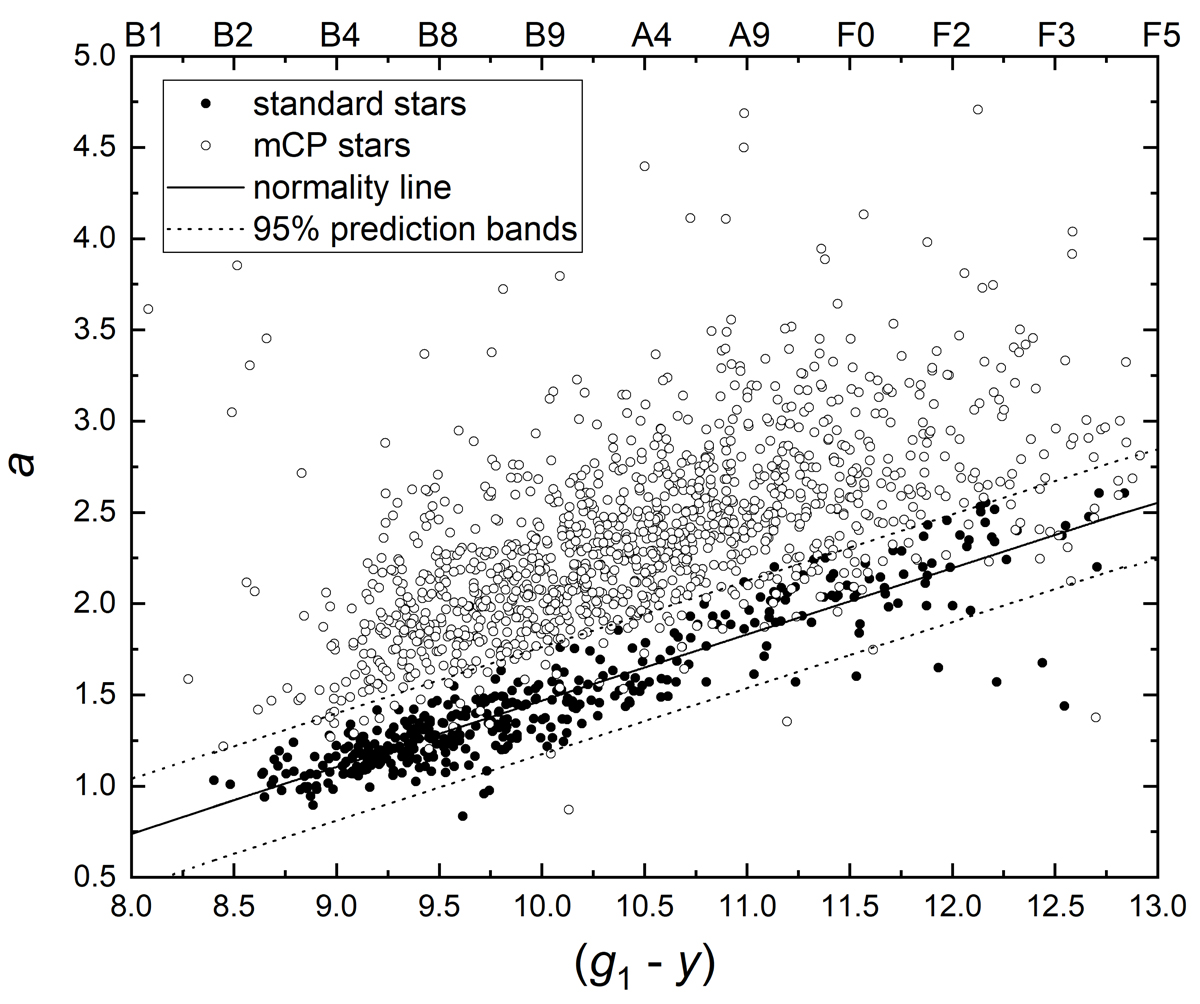
The a vs. (g1 − y) diagram for the 387 normal type (filled symbols) and 1240 mCP stars (open symbols). The normality line a = −2.16(8)+0.363(8)(g1 − y) is defined as in the classical Δa photometric system. The dotted lines are the 95% prediction bands to select mCP stars. We also indicated the approximate spectral types according to the CMD (Fig. 1).
Current usage metrics show cumulative count of Article Views (full-text article views including HTML views, PDF and ePub downloads, according to the available data) and Abstracts Views on Vision4Press platform.
Data correspond to usage on the plateform after 2015. The current usage metrics is available 48-96 hours after online publication and is updated daily on week days.
Initial download of the metrics may take a while.