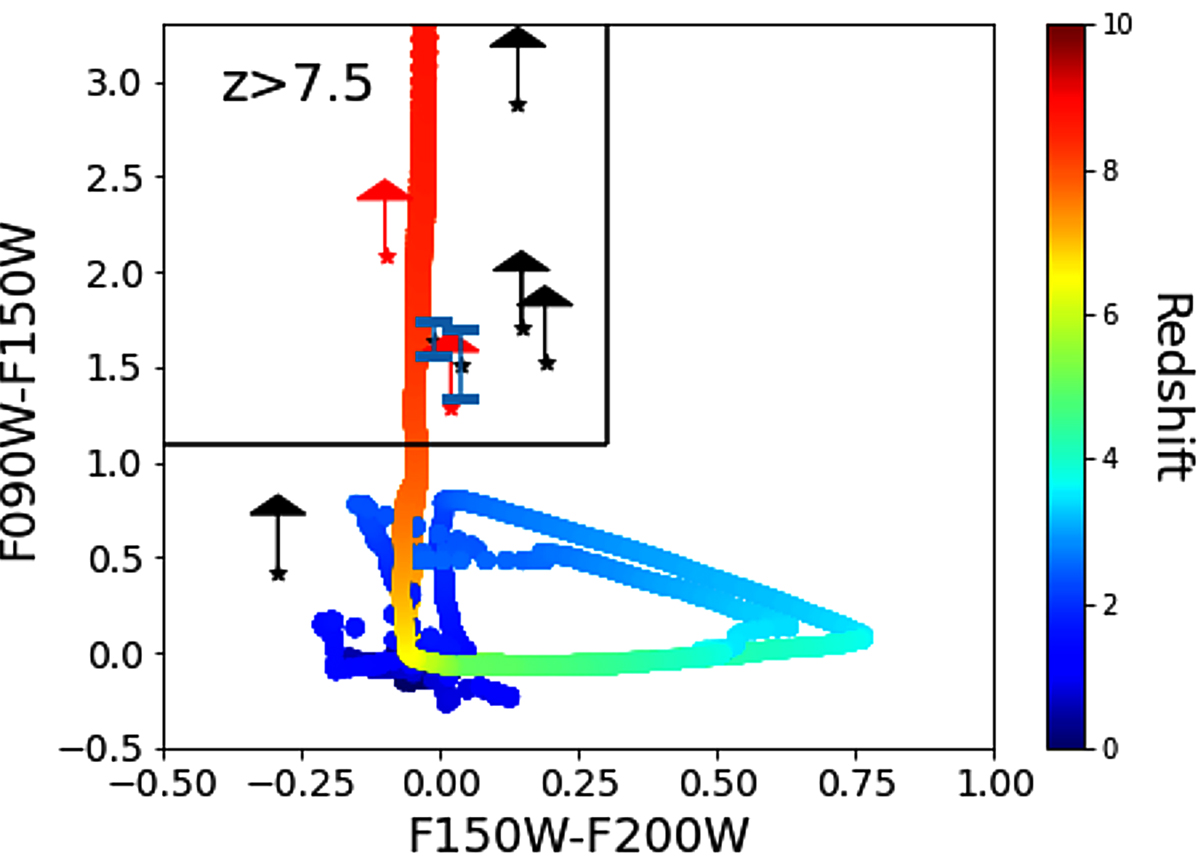
Fig. 2.
Download original image
Colour–colour plot used to select galaxies with colour similar to the two galaxies spectroscopically confirmed. The stars show the positions of the eight objects identified in a 40″ × 40″ region. The red dots show the positions of the two spectroscopically confirmed galaxies. Lower limits are computed assuming the 2σ depth of the F090W image.
Current usage metrics show cumulative count of Article Views (full-text article views including HTML views, PDF and ePub downloads, according to the available data) and Abstracts Views on Vision4Press platform.
Data correspond to usage on the plateform after 2015. The current usage metrics is available 48-96 hours after online publication and is updated daily on week days.
Initial download of the metrics may take a while.